
SLIDE 1
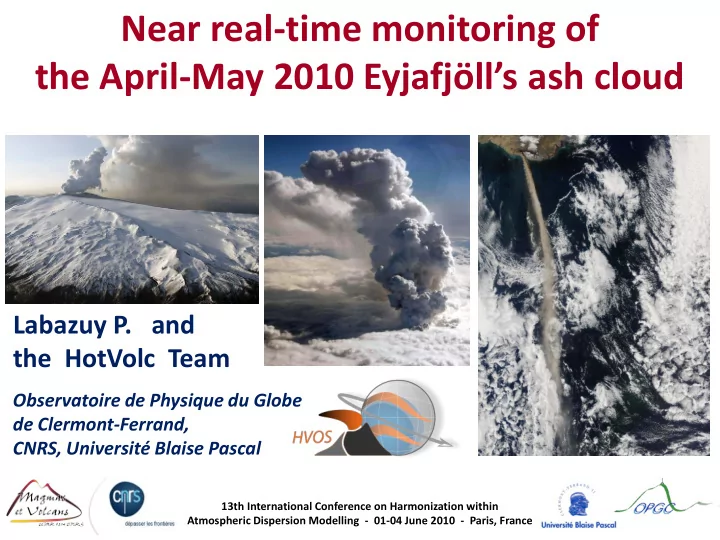
Near real-time monitoring of the April-May 2010 Eyjafjöll’s ash cloud
13th International Conference on Harmonization within Atmospheric Dispersion Modelling - 01-04 June 2010 - Paris, France
Near real-time monitoring of the April-May 2010 Eyjafjlls ash cloud - - PowerPoint PPT Presentation
Near real-time monitoring of the April-May 2010 Eyjafjlls ash cloud Labazuy P. and the HotVolc Team Observatoire de Physique du Globe de Clermont-Ferrand, CNRS, Universit Blaise Pascal 13th International Conference on Harmonization
13th International Conference on Harmonization within Atmospheric Dispersion Modelling - 01-04 June 2010 - Paris, France
Introduction | Eyjafjöll’s Eruption | HotVolc | Real-Time | Quantification | Conclusion
13th International Conference on Harmonization within Atmospheric Dispersion Modelling - 01-04 June 2010 - Paris, France
Introduction | Eyjafjöll’s Eruption | HotVolc | Real-Time | Quantification | Conclusion
13th International Conference on Harmonization within Atmospheric Dispersion Modelling - 01-04 June 2010 - Paris, France
Introduction | Eyjafjöll’s Eruption | HotVolc | Real-Time | Quantification | Conclusion
13th International Conference on Harmonization within Atmospheric Dispersion Modelling - 01-04 June 2010 - Paris, France
Introduction | Eyjafjöll’s Eruption | HotVolc | Real-Time | Quantification | Conclusion
13th International Conference on Harmonization within Atmospheric Dispersion Modelling - 01-04 June 2010 - Paris, France
Source : NASA/Terra-MODIS, April 19, 2010 ,12:50
Introduction | Eyjafjöll’s Eruption | HotVolc | Real-Time | Quantification | Conclusion
13th International Conference on Harmonization within Atmospheric Dispersion Modelling - 01-04 June 2010 - Paris, France
Introduction | Eyjafjöll’s Eruption | HotVolc | Real-Time | Quantification | Conclusion
13th International Conference on Harmonization within Atmospheric Dispersion Modelling - 01-04 June 2010 - Paris, France
The eruption has been characterized by two main phases of intense ash emissions spanning April 14-21 and May 1-10, with a maximum intensity recorded on M
Introduction | Eyjafjöll’s Eruption | HotVolc | Real-Time | Quantification | Conclusion
13th International Conference on Harmonization within Atmospheric Dispersion Modelling - 01-04 June 2010 - Paris, France
Introduction | Eyjafjöll’s Eruption | HotVolc | Real-Time | Quantification | Conclusion
13th International Conference on Harmonization within Atmospheric Dispersion Modelling - 01-04 June 2010 - Paris, France
Introduction | Eyjafjöll’s Eruption | HotVolc | Real-Time | Quantification | Conclusion
13th International Conference on Harmonization within Atmospheric Dispersion Modelling - 01-04 June 2010 - Paris, France
Introduction | Eyjafjöll’s Eruption | HotVolc | Real-Time | Quantification | Conclusion
13th International Conference on Harmonization within Atmospheric Dispersion Modelling - 01-04 June 2010 - Paris, France
Introduction | Eyjafjöll’s Eruption | HotVolc | Real-Time | Quantification | Conclusion
13th International Conference on Harmonization within Atmospheric Dispersion Modelling - 01-04 June 2010 - Paris, France
Satellites Sensors Temporal Resolution Spatial Resolution Spectral Domain Field Studies
Aura OMI 1 img / 24h 12km × 24km UV-VIS (270-532nm) SO2 loading Ash index Aqua/Terra MODIS 4 img / 24h 1km × 1km 0.6 - 14.4µm Ash loading SO2 loading Calipso CALIOP 2 img / 24h 30m × 333m 532-1064nm Ash loading Ash properties Meteosat SEVIRI 1 img / 15min 3km × 3km 0.6 - 13.4µm Ash loading SO2 loading
Introduction | Eyjafjöll’s Eruption | HotVolc | Real-Time | Quantification | Conclusion
13th International Conference on Harmonization within Atmospheric Dispersion Modelling - 01-04 June 2010 - Paris, France
Operational Warning and Alert Ministry Center
METEO-FRANCE IPGP-OPGC Ministry CNRS-INSU
Introduction | Eyjafjöll’s Eruption | HotVolc | Real-Time | Quantification | Conclusion
13th International Conference on Harmonization within Atmospheric Dispersion Modelling - 01-04 June 2010 - Paris, France
Introduction | Eyjafjöll’s Eruption | HotVolc | Real-Time | Quantification | Conclusion
13th International Conference on Harmonization within Atmospheric Dispersion Modelling - 01-04 June 2010 - Paris, France
Introduction | Eyjafjöll’s Eruption | HotVolc | Real-Time | Quantification | Conclusion
13th International Conference on Harmonization within Atmospheric Dispersion Modelling - 01-04 June 2010 - Paris, France
3-channels IR composition using MSG-9- SEVIRI data (3x3 km)
Introduction | Eyjafjöll’s Eruption | HotVolc | Real-Time | Quantification | Conclusion
13th International Conference on Harmonization within Atmospheric Dispersion Modelling - 01-04 June 2010 - Paris, France
3-channels IR composition using MSG-9-SEVIRI data (3x3 km, 15 min) HRV (High Resolution Visible, 1x1 km, 5min) MSG-8 RSS image Real-time MSG-9 every 15 min, up to every 5 min with MSG-8 RSS -Rapid Scan Service- images
Introduction | Eyjafjöll’s Eruption | HotVolc | Real-Time | Quantification | Conclusion
13th International Conference on Harmonization within Atmospheric Dispersion Modelling - 01-04 June 2010 - Paris, France
Ash cloud : dark blue Water droplets : deep green Ice crystals : bright red
Chronology of ash dispersal area mapped from MSG-SEVIRI and the Lidar CALIOP- Calipso during the first few days
Introduction | Eyjafjöll’s Eruption | HotVolc | Real-Time | Quantification | Conclusion
13th International Conference on Harmonization within Atmospheric Dispersion Modelling - 01-04 June 2010 - Paris, France
Mass flux of SO2 Ash radius Ash cloud Altitude Ash Concentration
Introduction | Eyjafjöll’s Eruption | HotVolc | Real-Time | Quantification | Conclusion
13th International Conference on Harmonization within Atmospheric Dispersion Modelling - 01-04 June 2010 - Paris, France
Mass flux of SO2 Ash radius Ash cloud Altitude Ash Concentration
Introduction | Eyjafjöll’s Eruption | HotVolc | Real-Time | Quantification | Conclusion
13th International Conference on Harmonization within Atmospheric Dispersion Modelling - 01-04 June 2010 - Paris, France
Mass Flux and Ash Concentration
Introduction | Eyjafjöll’s Eruption | HotVolc | Real-Time | Quantification | Conclusion
13th International Conference on Harmonization within Atmospheric Dispersion Modelling - 01-04 June 2010 - Paris, France
Ash emissions focused on 2 main phases : 14-21 April and 1-10 May
SO2 emitted much more constantly
Introduction | Eyjafjöll’s Eruption | HotVolc | Real-Time | Quantification | Conclusion
13th International Conference on Harmonization within Atmospheric Dispersion Modelling - 01-04 June 2010 - Paris, France
Introduction | Eyjafjöll’s Eruption | HotVolc | Real-Time | Quantification | Conclusion
13th International Conference on Harmonization within Atmospheric Dispersion Modelling - 01-04 June 2010 - Paris, France