
SLIDE 1
NATIONAL OUTLOOK
(CONSENSUS FORECASTING GROUP)
- J. MICHAEL JONES, PHD
DECEMBER 17, 2019
Office of State Budget Director
1
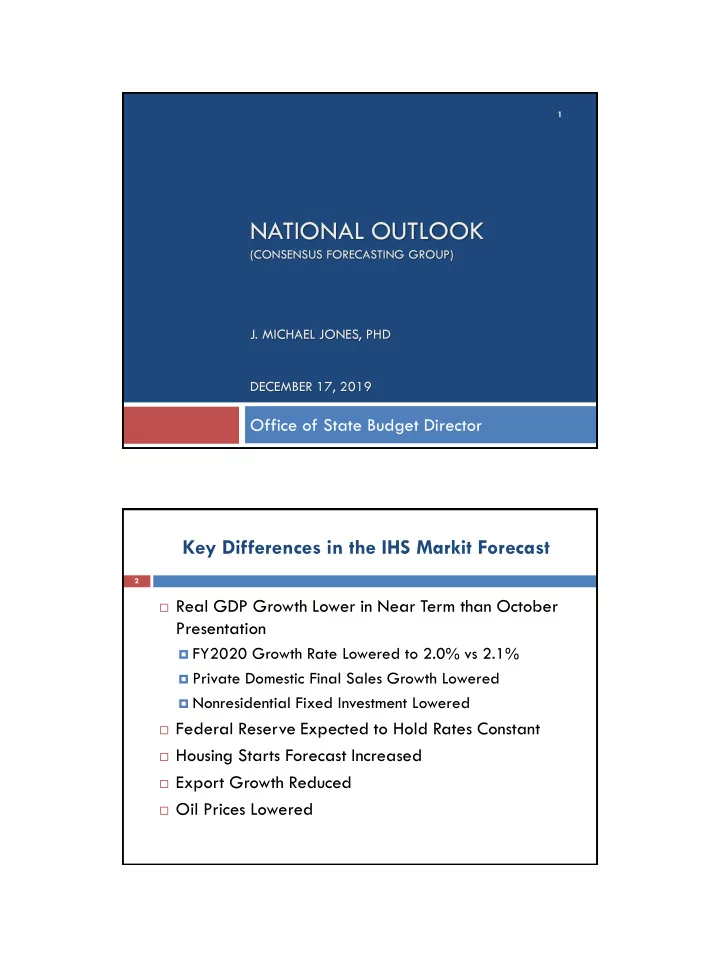
Key Differences in the IHS Markit Forecast
Real GDP Growth Lower in Near Term than October
Presentation
FY2020 Growth Rate Lowered to 2.0% vs 2.1% Private Domestic Final Sales Growth Lowered Nonresidential Fixed Investment Lowered
Federal Reserve Expected to Hold Rates Constant Housing Starts Forecast Increased Export Growth Reduced Oil Prices Lowered
2