
SLIDE 1
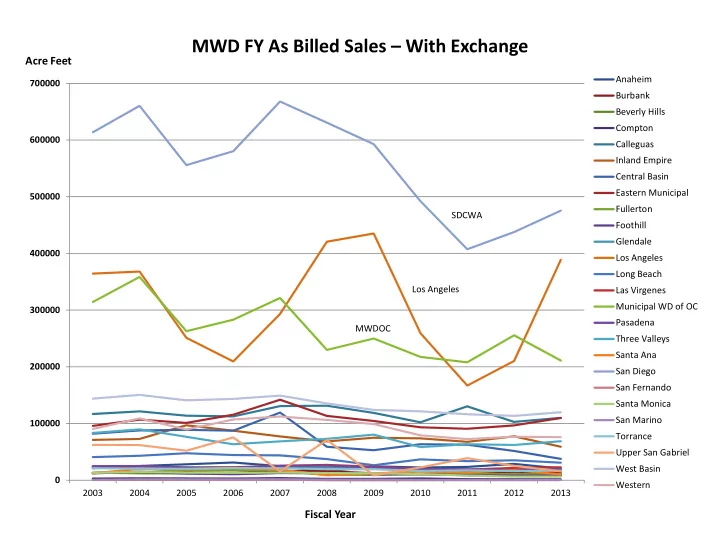
100000 200000 300000 400000 500000 600000 700000 2003 2004 2005 2006 2007 2008 2009 2010 2011 2012 2013 Anaheim Burbank Beverly Hills Compton Calleguas Inland Empire Central Basin Eastern Municipal Fullerton Foothill Glendale Los Angeles Long Beach Las Virgenes Municipal WD of OC Pasadena Three Valleys Santa Ana San Diego San Fernando Santa Monica San Marino Torrance Upper San Gabriel West Basin Western
MWD FY As Billed Sales – With Exchange
Acre Feet Fiscal Year
SDCWA Los Angeles MWDOC