SLIDE 1
100,000 200,000 300,000 400,000 500,000 600,000 700,000 2003 2004 2005 2006 2007 2008 2009 2010 2011 2012 2013 2014 2015
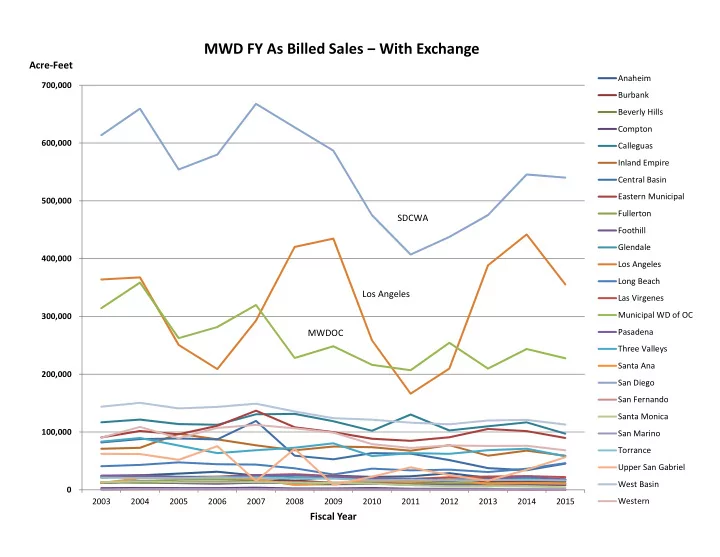
Fiscal Year
MWD FY As Billed Sales ‒ With Exchange
Anaheim Burbank Beverly Hills Compton Calleguas Inland Empire Central Basin Eastern Municipal Fullerton Foothill Glendale Los Angeles Long Beach Las Virgenes Municipal WD of OC Pasadena Three Valleys Santa Ana San Diego San Fernando Santa Monica San Marino Torrance Upper San Gabriel West Basin Western
SDCWA Los Angeles MWDOC
Acre‐Feet
SLIDE 2
100,000 200,000 300,000 400,000 500,000 600,000 700,000 2003 2004 2005 2006 2007 2008 2009 2010 2011 2012 2013 2014 2015
Fiscal Year
MWD FY As Billed Sales ‒ Without Exchange
Anaheim Burbank Beverly Hills Compton Calleguas Inland Empire Central Basin Eastern Municipal Fullerton Foothill Glendale Los Angeles Long Beach Las Virgenes Municipal WD of OC Pasadena Three Valleys Santa Ana San Diego San Fernando Santa Monica San Marino Torrance Upper San Gabriel West Basin Western
SDCWA Los Angeles MWDOC
Acre‐Feet
SLIDE 3
20,000 40,000 60,000 80,000 100,000 120,000 140,000 160,000 2003 2004 2005 2006 2007 2008 2009 2010 2011 2012 2013 2014 2015
Fiscal Year
MWD FY As Billed Sales ‒ With or Without Exchange Minus SDCWA, LADWP, MWDOC
Anaheim Burbank Beverly Hills Compton Calleguas Inland Empire Central Basin Eastern Municipal Fullerton Foothill Glendale Long Beach Las Virgenes Pasadena Three Valleys Santa Ana San Fernando Santa Monica San Marino Torrance Upper San Gabriel West Basin Western
Acre‐Feet
SLIDE 4
100,000 200,000 300,000 400,000 500,000 600,000
MWD Direct Deliveries 2014/15 Total Local Use 2014/15
Volume Water Use By MWD’s Member Agencies Local Production plus MWD Deliveries
Acre‐Feet
Total Local Use 1,836,798 af MWD Direct Deliveries 1,775,799 af Total Water Use 3,612,597 af
Local Production = groundwater, surface water, recycled wastewater, LA Aqueduct supplies and any use of MWD’s replenishment deliveries Total Local Use includes net imports from other member or non‐MWD agencies, not including water used for environmental purposes MWD Direct Deliveries include SDCWA/MWD Exchange Source: MWD 2015 Annual Report, pp.15‐16, Table 1‐4
SLIDE 5
0% 10% 20% 30% 40% 50% 60% 70% 80% 90% 100%
MWD Direct Deliveries 2014/15 Total Local Use 2014/15
Percent Water Use By MWD’s Member Agencies Local Production plus MWD Deliveries
MWD Direct Deliveries as % of Total Use = 49%
Local Production = groundwater, surface water, recycled wastewater, LA Aqueduct supplies and any use of MWD’s replenishment deliveries Total Local Use includes net imports from other member or non‐MWD agencies, not including water used for environmental purposes MWD Direct Deliveries include SDCWA/MWD Exchange Source: MWD 2015 Annual Report, pp.15‐16, Table 1‐4