
SLIDE 1
Mutations, the molecular clock, and models of sequence evolution
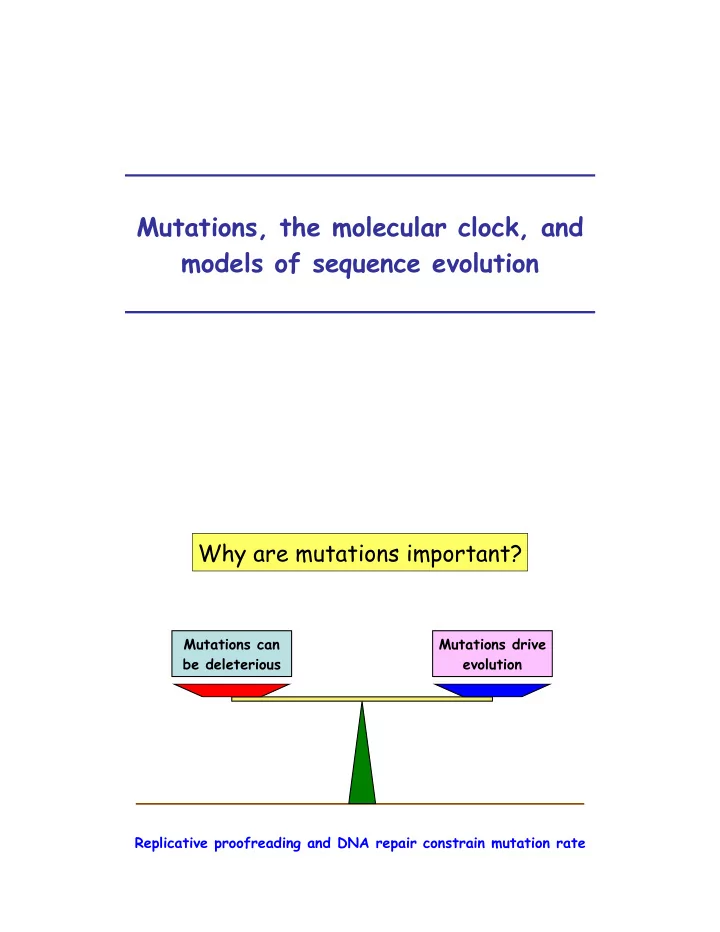
Why are mutations important?
Mutations can be deleterious Mutations drive evolution Replicative proofreading and DNA repair constrain mutation rate
Mutations, the molecular clock, and models of sequence evolution - - PDF document
Mutations, the molecular clock, and models of sequence evolution Why are mutations important? Mutations can Mutations drive be deleterious evolution Replicative proofreading and DNA repair constrain mutation rate UV damage to DNA UV
Why are mutations important?
Mutations can be deleterious Mutations drive evolution Replicative proofreading and DNA repair constrain mutation rate
Thymine dimers
UV
What happens if damage is not repaired?
Deinococcus radiodurans is amazingly resistant to ionizing radiation
DNA Structure
A T G C A T C G
OH
A T
OH
Information polarity Strands complementary 5’ 5’ 3’ 3’ G-C: 3 hydrogen bonds A-T: 2 hydrogen bonds Two base types:
Not all base substitutions are created equal
Transition rate ~2x transversion rate
Alignment of 3,165 human-mouse pairs
Substitution rates differ across genomes
Splice sites Start of transcription Polyadenylation site
Mutations vs. Substitutions
that evolution has tolerated Which rate is greater? How are mutations inherited? Are all mutations bad?
Selectionist vs. Neutralist Positions
deleterious; removed via negative selection
positively selected
selection
deleterious beneficial
deleterious, many mutations neutral
alter fitness
from genetic drift
deleterious neutral beneficial
What is the rate of mutations?
Rate of substitution constant: implies that there is a molecular clock Rates proportional to amount of functionally constrained sequence
(1) The clock has important implications for
molecular evolution. (2) The clock can help establish a time scale for evolution.
Why care about a molecular clock?
A B Ancestral sequence
Dating evolutionary events with a molecular clock
What are the assumptions? Can now date this event
T T
T = years since divergence K = substitutions since divergence
C
different mutation rates, changes in gene function, natural selection
useful at all?
Properties of the molecular clock Measuring sequence divergence: Why do we care?
searches of databases
fossil record
How do you measure how different two homologous DNA sequences are?
p distance = # differences / aligned length p distance = 4/20 = 0.2
Sequence 0 Sequence 2 Sequence 1
t
A sequence mutating at random
1
Multiple substitutions at one site can cause underestimation of number of substitutions
12 1 3
*
5
*
6
*
7
*
8
*
9
*
10
*
11
*
12 2
*
4
9 substitutions 5 pairwise changes
Simulating 10,000 random mutations to a 10,000 base pair sequence
Graph of Distance vs. Substitutions is not linear
Substitutions Sequence distance
Wouldn’t it be great to be able to correct for multiple substitutions?
True # subs (K) = CF x p distance What probabilities does this correction factor need to consider?
A C T G
sequence evolution?
Base frequencies equal, all substitutions equally likely Theoretical expression of nucleotide composition and likelihood of each possible base substitution ”instantaneous rate matrix” Q = rate of substitution per site
Q = [A] [C] [G] [T] [A]
subs/time = 3
will be 3t subs
know or t !…
Step 1 - Define rate matrix
…But we do know relationship between K, , and t
# subs = K = 2(3t)
3t 3t Can we express p distance in terms of and t ?
K = Correction factor x p distance
PA(1) = PA(0)-3 = 1-3 PA(0) = 1
Step 2 - Derive Pnt(t+1) in terms of Pnt(t) and
PA(t+1) = (1-3) PA(t) + (1-PA(t)) PA(2) = (1-3) PA(1) + (1-PA(1))
(Rate of change to another nt = )
= prob. of staying A x prob. stayed A 1st time + prob. A changed first time x prob. reverted to A A C T G
PA(t+1) = (1-3) PA(t) + (1-PA(t)) Pii(t)= 1/4 + 3/4e-4t Pij(t)= 1/4 - 1/4e-4t Probability nt stays same Probability nt changes
Step 3 - Derive probabilities of nt staying same or changing for time t
p = 1 – prob. that they are identical p = 1 – (prob. of both staying the same +
p = 1 – { (PAA(t))2 + (PAT(t))2 + (PAC(t))2 + (PAG(t))2 }
Step 4 - compute probability that two homologous sequences differ at a given position
p = 3/4(1- e-8t)
p = 3/4(1- e-8t) Number subs = K = 2(3t) K = -3/4 ln(1-4/3p)
Step 5 - calculate number of subs in terms of proportion of sites that differ
3t 3t 8t = -ln(1- 4/3p)
For p=0.25, K=0.304
K = Correction factor x p distance
What about substitutions between protein sequences?
20x20
acid change: K = -19/20 ln(1-20/19p)****
But it’s more complicated to model protein sequence evolution
not a uniform length
effects on protein function
acid substitutions
matrix
closely related proteins.
evolutionary trees
accepted mutations
The PAM model of protein sequence evolution Original PAM substitution matrix
Dayhoff, 1978
Count number of times residue b was replaced with residue a = Ai,j j i
Deriving PAM matrices
mj = # times a.a. j mutated total occurrences of a.a. For each amino acid, calculate relative mutabilities: Likelihood a.a. will mutate
Deriving PAM matrices
Calculate mutation probabilities for each possible substitution Mi,j = relative mutability x proportion of all subs of j represented by change to i mj x Ai,j Mi,j = Ai,j
i
Mj,j = 1- mj = probability of j staying same
PAM1 mutation probability matrix
Dayhoff, 1978
j i Probabilities normalized to 1 a.a. change per 100 residues
Deriving PAM matrices
Calculate log odds ratio to convert mutation probability to substitution score (Mi,j)
Frequency of residue i (Probability of a.a. i
Mutation probability (Prob. substitution from j to i is an accepted mutation)
Si,j = 10 x log10 fi
Deriving PAM matrices
Scoring in log odds ratio:
Interpretation of score:
Using PAM scoring matrices
PAM1 - 1% difference (99% identity) Can “evolve” the mutation probability matrix by multiplying it by itself, then take log odds ratio (PAMn = PAM matrix multiplied n times)
BLOSUM = BLOCKS substitution matrix
use log odds ratio to calculate sub. scores
regions of distantly related proteins
Gapless alignment blocks
BLOSUM uses clustering to reduce sequence bias
(e.g. 62% for BLOSUM 62 matrix)
BLOSUM and PAM substitution matrices
BLOSUM 30 BLOSUM 62 BLOSUM 90 % identity PAM 250 (80) PAM 120 (66) PAM 90 (50) % change change
BLAST algorithm uses BLOSUM 62 matrix
related proteins - short evolutionary period
extrapolated
extrapolation
divergent proteins-longer evolutionary period
separately
alignment errors
PAM BLOSUM
Importance of scoring matrices
sequence comparison.