mol2net 2018 4 http sciforum net conference mol2net 04 2
play

MOL2NET, 2018 , 4, http://sciforum.net/conference/mol2net-04 2 - PDF document

MOL2NET, 2018 , 4, http://sciforum.net/conference/mol2net-04 1 MDPI MOL2NET, International Conference Series on Multidisciplinary Sciences " Web Application for Real Time Data Visualization of Heat Sensors " Bernabe Ortega-Tenezaca a, b,


  1. MOL2NET, 2018 , 4, http://sciforum.net/conference/mol2net-04 1 MDPI MOL2NET, International Conference Series on Multidisciplinary Sciences " Web Application for Real Time Data Visualization of Heat Sensors " Bernabe Ortega-Tenezaca a, b, c , Viviana F. Quevedo-Tumailli a, c , Víctor Cerda Mejía c , Octavio Edelberto Guijarro Rubí d , Estela Guardado Yordi e and Amaury Pérez Martínez c, e a RNASA-IMEDIR, Computer Science Faculty, University of A Coruña, 15071, A Coruña, Spain. b Universidad Regional Autónoma de los Andes Uniandes – Puyo, Pastaza, Ecuador. c Universidad Estatal Amazónica – Puyo, Pastaza, Ecuador. d Instituto Superior Tecnológico Francisco de Orellana – Puyo, Pastaza, Ecuador. e Universidad de Camagüey, Cuba. 
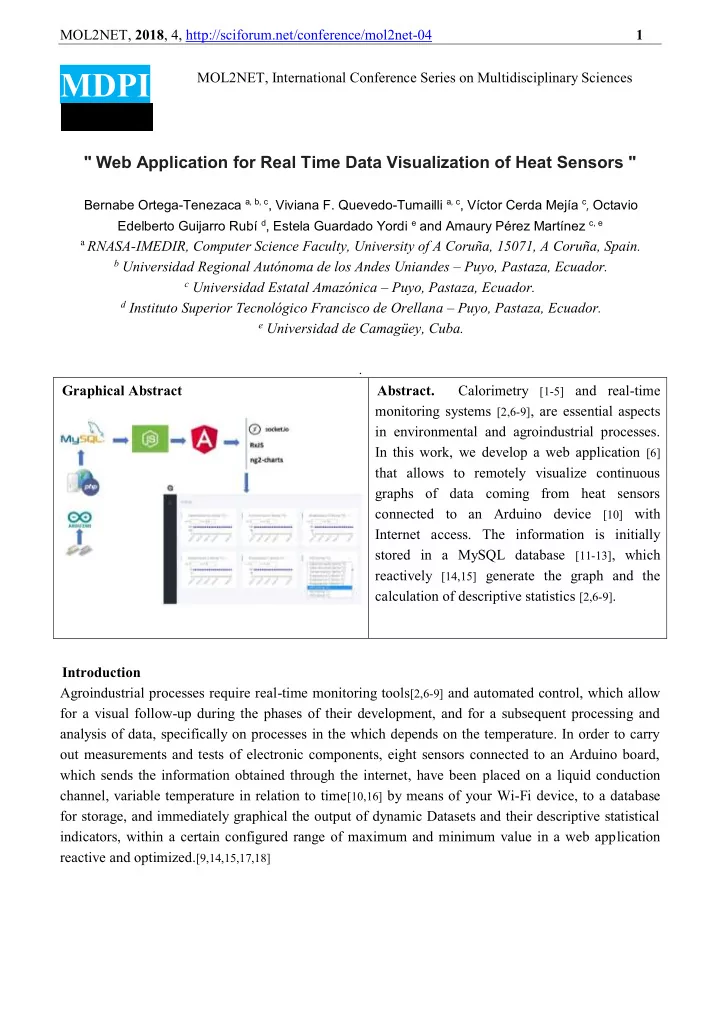
. Graphical Abstract Abstract. Calorimetry [1-5] and real-time monitoring systems [2,6-9] , are essential aspects in environmental and agroindustrial processes. In this work, we develop a web application [6] that allows to remotely visualize continuous graphs of data coming from heat sensors connected to an Arduino device [10] with Internet access. The information is initially stored in a MySQL database [11-13] , which reactively [14,15] generate the graph and the calculation of descriptive statistics [2,6-9] . Introduction Agroindustrial processes require real-time monitoring tools [2,6-9] and automated control, which allow for a visual follow-up during the phases of their development, and for a subsequent processing and analysis of data, specifically on processes in the which depends on the temperature. In order to carry out measurements and tests of electronic components, eight sensors connected to an Arduino board, which sends the information obtained through the internet, have been placed on a liquid conduction channel, variable temperature in relation to time [10,16] by means of your Wi-Fi device, to a database for storage, and immediately graphical the output of dynamic Datasets and their descriptive statistical indicators, within a certain configured range of maximum and minimum value in a web application reactive and optimized. [9,14,15,17,18]

  2. MOL2NET, 2018 , 4, http://sciforum.net/conference/mol2net-04 2 Materials and methods For the development of real-time monitoring software, an Arduino computer with temperature sensors was used, which emits its signal through a PHP / GET application with 8 numerical variables housed in a 64-bit Linux shared server, with MySQL, where stored values are stored from the sensors of an Arduino equipment called Heater, Concentrator, Evaporator3, Evaporator2, Evaporator1, Sensor7, and Sensor8. Technological tools such as Nodejs [19] are used through WebSockets [9,16] with a pooling interval setting of 500, and a reactive application [15] developed in Angular5 [14,17] using the external graphical library ng2-chart, and material angular, by subscription to the service through an Observable object, provided by the module httpClientModule. Results and Discussion During the data collection, 84903 records are obtained corresponding to 16 processes performed on different dates whose averages are shown in table 1, and random test values greater than 1000, called Testing Values. [T-V] Sensors Date Calentador Concentrador Evaporador 3 Evaporador 2 Evaporador 1 Sensor 6 Sensor 7 Sensor 8 24/04/2018 66,9 100,2 93,9 92,6 89,4 [T-V] [T-V] [T-V] 25/04/2018 [T-V] [T-V] [T-V] [T-V] 96,9 [T-V] [T-V] [T-V] 26/04/2018 71,0 [T-V] 80,4 79,1 81,9 [T-V] [T-V] [T-V] 27/04/2018 83,4 [T-V] 99,7 98,5 96,3 [T-V] [T-V] [T-V] 03/05/2018 12,0 12,0 12,0 12,0 12,0 [T-V] [T-V] [T-V] 07/05/2018 48,2 106,3 [T-V] [T-V] [T-V] [T-V] [T-V] [T-V] 08/05/2018 24,4 24,0 [T-V] [T-V] [T-V] [T-V] [T-V] [T-V] 09/05/2018 165,1 [T-V] [T-V] [T-V] [T-V] [T-V] [T-V] [T-V] 10/05/2018 44,3 59,4 [T-V] [T-V] [T-V] [T-V] [T-V] [T-V] 11/05/2018 62,3 104,8 84,7 74,4 84,5 [T-V] [T-V] [T-V] 15/05/2018 [T-V] 124,3 98,5 96,4 91,9 [T-V] [T-V] [T-V] 23/05/2018 99,9 113,3 98,1 [T-V] 71,9 [T-V] [T-V] [T-V] 29/05/2018 27,2 24,5 26,5 31,5 48,6 [T-V] [T-V] [T-V] 31/05/2018 73,5 116,7 93,7 98,2 95,0 [T-V] [T-V] [T-V] 11/06/2018 77,3 123,6 98,9 95,8 [T-V] [T-V] [T-V] [T-V] 12/06/2018 73,8 113,0 98,7 213,1 [T-V] [T-V] [T-V] [T-V] Table 1: Average values stored in the database The website developed for this purpose shows the maximum value, minimum sum of values, average, range, mean range, variance and standard deviation in real time.

  3. MOL2NET, 2018 , 4, http://sciforum.net/conference/mol2net-04 3 The web application is capable of receiving data from any authorized device that has an Internet connection, where you can observe the behavior of the data based on the time between a set range, initially supports 8 simultaneous sensors, and its accuracy is determined for the accuracy of the measuring instruments. The numerical values of the dynamically generated Datasets can be treated according to the experiment carried out since each of the sensor graphs are individual legacy containers, thus allowing vertical scalability in terms of measurement hardware. References 1. Diener, J.R.C. Calorimetria indireta. 1997 , 43 , 245-253. 2. García, E.; Amaya, I.; Correa, R. Algoritmos de optimización en la estimación de propiedades termodinámicas en tiempo real durante el tratamiento térmico de materiales con microondas. 2017 , 16 , 129-140. 3. Pineda-Gómez, P.; Coral, D.F.; Arciniegas, M.L.; Rorales-Rivera, A.; Rodríguez García, M.E. Papel del agua en la gelatinización del almidón de maíz: estudio por calorimetría diferencial de barrido. 2010 , 6 , 129-141. 4. Reyes, O.; Cadena, O.; Correa, R. Diseño de un prototipo para la medición de flujo de calor mediante calorimetría directa usando sensado por variación de temperatura. 2007 , 85-106. 5. Sandoval Aldana, A.; Rodriguez Sandoval, E.; Fernández Quintero, A. Aplicación del análisis por calorimetría diferencial de barrido (DSC) para la caracterización de las modificaciones del almidón. 2005 , 72 , 45-53. 6. Alfian, G.; Syafrudin, M.; Rhee, J. Real-Time Monitoring System Using Smartphone-Based Sensors and NoSQL Database for Perishable Supply Chain. 2017 , 9 , 2073. 7. González Coneo, J.; Nuñez Pérez, B.; Viloria Molinares, P. Sistema de monitoreo en tiempo real para la medición de temperatura. 2012 , 2 , 128-132. 8. Hofmann, M.P.; Nazhat, S.N.; Gbureck, U.; Barralet, J.E. Real‐time monitoring of the setting reaction of brushite‐forming cement using isotherma l differential scanning calorimetry. 2006 , 79 , 360-364. 9. Pimentel, V.; Nickerson, B. Communicating and displaying real-time data with WebSocket. 2012 , 16 , 45-53. 10. Ferdoush, S.; Li, X. Wireless sensor network system design using Raspberry Pi and Arduino for environmental monitoring applications. 2014 , 34 , 103-110.

  4. MOL2NET, 2018 , 4, http://sciforum.net/conference/mol2net-04 4 11. Bhargava, N.; Garhwal, A.S.; Mathuria, M.; Kailash, K.M.; Applications in Engineering, T.; Sciences, I. Database Optimization by Connection Pooling for Heterogeneous Users. 0974- 3588. 12. Gupta, K.; Mathuria, M. Improving performance of web application approaches using connection pooling. In Proceedings of Electronics, Communication and Aerospace Technology (ICECA), 2017 International conference of; pp. 355-358. 13. Tiwari, A.; Yadav, S.; Mathuria, M.; Sharma, M.; Chaudhary, H. Performance Optimization of Web Applications using Connection Pooling. ICIIECS: 2016. 14. Clow, M. RxJS with Angular. In Angular 5 Projects , Springer: 2018; pp. 309-313. 15. Clow, M. Observers, Reactive Programming, and RxJS. In Angular 5 Projects , Springer: 2018; pp. 291-307. 16. Fette, I.; Melnikov, A. The websocket protocol ; 2070-1721; 2011. 17. Jain, N.; Bhansali, A.; Mehta, D. AngularJS: A modern MVC framework in JavaScript. 2015 , 5 , 17-23. 18. Mamani, M.; Villalobos, M.; Herrera, R. Sistema web de bajo costo para monitorear y controlar un invernadero agrícola. 2017 , 25 , 599-618. 19. Tilkov, S.; Vinoski, S. Node. js: Using JavaScript to build high-performance network programs. 2010 , 14 , 80-83.

Download Presentation
Download Policy: The content available on the website is offered to you 'AS IS' for your personal information and use only. It cannot be commercialized, licensed, or distributed on other websites without prior consent from the author. To download a presentation, simply click this link. If you encounter any difficulties during the download process, it's possible that the publisher has removed the file from their server.

Recommend


More recommend