MOL2NET, 2018 , 4, http://sciforum.net/conference/mol2net-04 2 min. - - PDF document

mol2net 2018 4 http sciforum net conference mol2net 04 2
SMART_READER_LITE
LIVE PREVIEW

MOL2NET, 2018 , 4, http://sciforum.net/conference/mol2net-04 2 min. - - PDF document

MOL2NET, 2018 , 4, http://sciforum.net/conference/mol2net-04 1 MDPI MOL2NET, International Conference Series on Multidisciplinary Sciences http://sciforum.net/conference/mol2net-03 Development and validation of RP-HPLC method for the estimation


slide-1
SLIDE 1

MOL2NET, 2018, 4, http://sciforum.net/conference/mol2net-04 1 1

MDPI

MOL2NET, International Conference Series on Multidisciplinary Sciences http://sciforum.net/conference/mol2net-03

Development and validation of RP-HPLC method for the estimation of Tigecycline in bulk and its parenteral dosage form.

M AKIFUL HAQUEa, Sandeep Reddya, Gowri Manoja Mulagadaa, Vasudha Bakshia.

a School of Pharmacy, Anurag Group of Institutions, Venkatapur (V), Ghatkaser (M), Medchal (D), Hyderabad- 500 088, Telangana, India- 500 088.

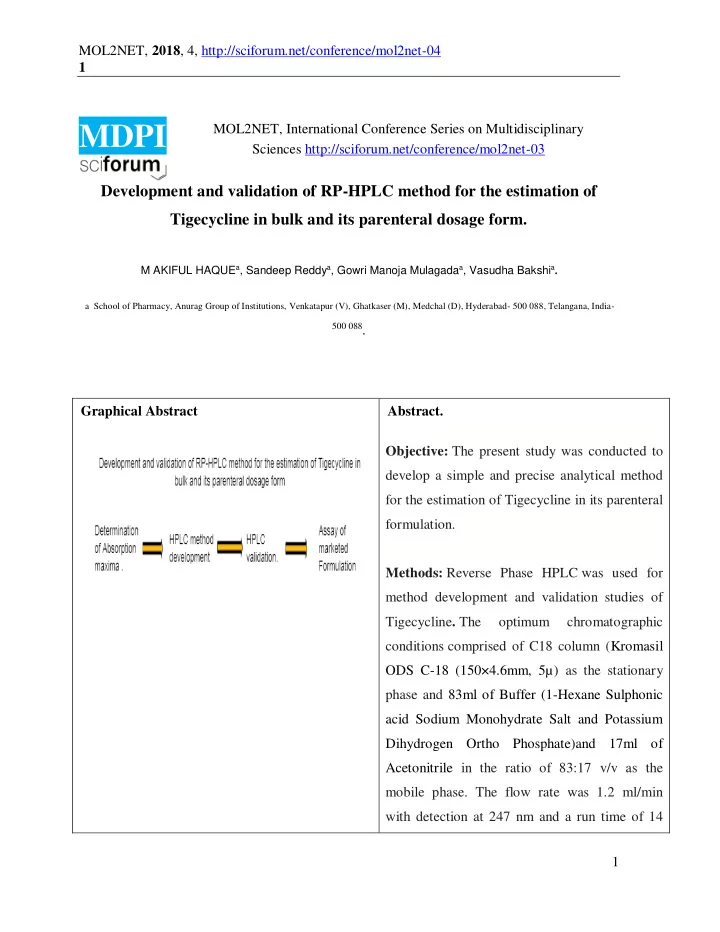
Graphical Abstract Abstract. Objective: The present study was conducted to develop a simple and precise analytical method for the estimation of Tigecycline in its parenteral formulation. Methods: Reverse Phase HPLC was used for method development and validation studies of

  • Tigecycline. The
  • ptimum

chromatographic conditions comprised of C18 column (Kromasil ODS C-18 (150×4.6mm, 5µ) as the stationary phase and 83ml of Buffer (1-Hexane Sulphonic acid Sodium Monohydrate Salt and Potassium Dihydrogen Ortho Phosphate)and 17ml of Acetonitrile in the ratio of 83:17 v/v as the mobile phase. The flow rate was 1.2 ml/min with detection at 247 nm and a run time of 14

slide-2
SLIDE 2

MOL2NET, 2018, 4, http://sciforum.net/conference/mol2net-04 2 2 min. Isocratic mode

  • f

separation was performed. Results: The retention time of Tigecycline was 7.6 min. The linearity studies indicated that the range of the developed method was 40-60 µg/ml with a correlation coefficient of 0.9999. The method was specific with a percent mean recovery was found to be 100.92%. The % RSD in the Intra-day precision studies was 0.54 and Inter-day precision studies were 0.28. The validated method was applied to conduct the assay of Tigecycline in parenteral dosage form with a percent mean recovery of 101.5%. The Limit of detection and limit of quantification values were found to be 1.8µg/ml and 5.42µg/ml. Conclusion: The developed and validated RP- HPLC isocratic method was simple, accurate and precise as per the ICH guidelines. It was suitable for the analysis of Tigecycline in bulk and parenteral formulation.

slide-3
SLIDE 3

MOL2NET, 2018, 4, http://sciforum.net/conference/mol2net-04 3 3 Introduction Tigecycline (Figure 1), chemically N-[(5aR,6aS,7S,9Z,10aS)-9-(amino-hydroxy-methylidene)- 4,7-bis(dimethylamino)-1,10a,12-trihydroxy-8,10,11-trioxo-5a,6,6a,7-tetrahydro-5H-tetracen- 2-yl]-2-(tert-butylamino)acetamide is a first in class of glycylcycline antibacterial for parentral

  • administration. It is considered as bacteriostatic which inhibits protein synthesis by inhibiting

protein translation in bacteria by preventing incorporation of amino acid residues in to elongating peptide chains. It was first marketed under the brand name of TYGACIL (1), approved in 2005 by USFDA. It is a broad spectrum antibiotic. It is used in the treatment of complicated skin and skin structure infections and complicated intra-abdominal infections. Tigecycline should be used only to treat infections that are proven strongly suspected to be caused by susceptible bacteria. Tigecycline is not recommended to use in the treatment of diabetic foot infections, ventilator associated pneumonia and avoid usage in patients with known tetracycline hypersensitivity. Literature survey (2-8) includes spectrophotometric, chromatographic etc. methods for the estimation of Tigecycline in Bulk drug and its formulations. Materials and Methods. Chemicals, solvents and drugs: Tigecycline reference sample was purchased from NATCO pharma pvt. Ltd, Nagarjuna sagar. The marketed formulation (TIGI, 50mg) was purchased from the local market. Acetonitrile of HPLC grade and orthophosphoric acid, potassium hydroxide, potassium dihydrogen

  • rthophosphate, 1-Hexane sulphonic acid sodium monohydrate salt of Analytical grade were

purchased from Merck Chemicals. HPLC grade water was prepared by using Millipore Milli-Q system. Equipments: The chromatographic system consists of HPLC with ALC 2010 isocratic pump and ASPD 2600 UV-Visible wavelength detector using Empower-2 chromatographic software. The column used was Kromasil ODS C-18 (150×4.6mm, 5µ). A 5µl-20µ1 autosample injector was

  • used. The pH of the solutions was adjusted with Digisun electronics digital pH meter. The
slide-4
SLIDE 4

MOL2NET, 2018, 4, http://sciforum.net/conference/mol2net-04 4 4 absorption maximum of the drug was found out by verifying standard solution of drug in SHIMADZU UV 1601. Preparation of buffer: Transfer about 1 gram of 1-Hexane Sulphonic acid Sodium Monohydrate Salt and about 1.36 grams of Potassium Dihydrogen Ortho Phosphate in to 1000ml of HPLC grade water. Dissolve completely and sonicate it for 20 minutes. Adjust the pH of the above solution to 3.2 ± 0.05 with Ortho Phosphoric acid. Filter the prepared solvent through 0.22µm newpore membrane filter. Preparation of diluent: Transfer 1.36grams of Potassium dihydrogen Ortho Phosphate and 1gram of Potassium Hydroxide in to 1000ml of HPLC grade water and dissolve it completely. Sonicate it for 10 minutes. Preparation of mobile phase: A mixture of 83ml of Buffer and 17ml of Acetonitrile in the ratio of 50:50 were set for the composition to the autosampler. Ensure both the solvents are perfectly degassed in ultrasonic water bath for 5 minutes, finally filtered through 0.22 µ membrane filter. Preparation of standard stock solution: The standard stock solution was prepared by transferring 50mg Tigecycline working standard into 100ml volumetric flask. To that, about 100ml of Diluent mixture was added and solution was sonicated to dissolve the drug. The standard solutions were filtered through a 0.22µm nylon membrane filter. Preparation of diluted standard stock solution: From the standard stock solution, 10ml of solution was taken in 50ml flask and further diluted with diluent. Results and Discussion

slide-5
SLIDE 5

MOL2NET, 2018, 4, http://sciforum.net/conference/mol2net-04 5 5 Method development and optimization of the chromatographic conditions. During the initial method optimization studies C18 columns with different column lengths and mobile phases were tried. Finally the below mentioned chromatographic conditions were finalized after evaluating column efficient parameters like theoretical plates, retention time, tailing and fronting. Wavelength was selected by scanning standard solution of drug in diluent

  • ver the range of 200nm to 400nm. The absorption maximum was found to be 247nm.

Blank chromatogram was achieved using mobile phase. The retention time of tigecycline was found to be 7.6 minutes. The proposed method is also applicable to tablet formulations. The

  • ptimized chromatographic conditions are given in Table 1.

Estimation of drug from parenteral dosage form. A vial of TIGI-50 mg consists of 5ml of 50 mg Tigecycline. 1 ml of the above solution was transferred to a 10 ml volumetric flask and diluted upto 10ml with diluent. This makes it 1000µg/ml solution. It was further diluted by taking 1ml of the above solution and diluting it upto 10ml with diluent to make a 100µg/ml solution. The above solution was chromatographed six times. The mean peak area of the drug was calculated and the drug content in the formulation was calculated by the regression equation method. The results are summarized in Table 2 and the chromatogram is given in Figure 2. Method Validation System suitability As per USP, system suitability is an integral part of the liquid chromatographic methods and no sample analysis is acceptable unless the requirements of system suitability have been met. Various parameters like has been validated for replicate

  • injections. The results were found to be in limit and given in Table 3.

Specificity The method was found to be specific for Tigecycline as the placebo chromatogram, no peaks were observed at the retention time of Tigecycline. The blank chromatogram and the specificity test was given in the Figure 3 and Figure 4.

slide-6
SLIDE 6

MOL2NET, 2018, 4, http://sciforum.net/conference/mol2net-04 6 6 Linearity and range The method was validated through linearity by different concentrations 40-60 µg/ml

  • f standard solution of Tigecycline. The calibration curve was plotted from peak area

against applied concentration and the regression equation was computed. The summary of parameters was given in Table 4. Accuracy To determine the accuracy of the method was determined by recovery experiments. Known amount of pure drug was spiked at 80%, 100% and 120% concentration

  • levels. Accuracy was calculated as per the percentage of recovery. The results were

tabulated in Table 5. Precision The precision of the method was demonstrated by intra-day and inter-day precision

  • studies. Intra-day studies were performed by injecting five (5) repeated injections of

100% concentration from tablet solution within a day. Inter-day precision studies, was done by injecting five (5) repeated injections of 100% concentration from tablet solution for six consecutive days. Peak area and %RSD were calculated. The result of the Precision as with %RSD is summarized in Table 6. Limit of detection (LOD) and limit of Quantification (LOQ). The LOD and LOQ was calculated by using the equations LOD = 3.3 ×

𝜏 𝑇 LOQ = 10 × 𝜏 𝑇

Where, σ is the standard deviation of intercept of calibration plot and S is the average of the slope of the corresponding calibration plot. The LOD and LOQ values for Tigecycline were reported in the Table 7. Robustness The method was found to be robust when small but deliberate variations were done in flow rate, detection wavelength, mobile phase composition and column temperature. It indicates reliability during normal usage. The summary of the parameters are given in Table 8.

slide-7
SLIDE 7

MOL2NET, 2018, 4, http://sciforum.net/conference/mol2net-04 7 7 Figure 1: Structure of Tigecycline. Figure 2: Chromatogram of the marketed Formulation. Figure 3: Chromatogram for system suitability. Figure 4: Blank chromatogram. Figure 5: Chromatogram for specificity test. Figure 6: Linearity graph.

Figures:

Figure 1: Structure

  • f

Tigecycline.

slide-8
SLIDE 8

MOL2NET, 2018, 4, http://sciforum.net/conference/mol2net-04 8 8 Figure 2: Chromatogram of the marketed Formulation Figure 3: Chromatogram for system suitability

slide-9
SLIDE 9

MOL2NET, 2018, 4, http://sciforum.net/conference/mol2net-04 9 9 Figure 4: Blank chromatogram Figure 5: Chromatogram for specificity test

slide-10
SLIDE 10

MOL2NET, 2018, 4, http://sciforum.net/conference/mol2net-04 10 10

3500000 3000000 2500000 peak area 2000000 1500000 1000000 500000 0 20 40 60 80 Concentration(µg/ml)

Figure 6: Linearity graph Table 1: Optimized chromatographic conditions of Tigecycline. Table 2: Analysis of Marketed formulation. Table 3: System suitability for repeated injections for Tigecycline. Table 4: Linearity parameters for tigecycline Table 5: Accuracy results for Tigecycline Table 6: Precision results (Intra-day and Inter-day for Tigecycline). Table 7: LOD and LOQ values

  • f

Tigecycline Table 1: Optimized chromatographic conditions

slide-11
SLIDE 11

MOL2NET, 2018, 4, http://sciforum.net/conference/mol2net-04 11 11 Stationary phase : Kromasil ODS C-18 column (150×4.6mm, 5µ) Mobile phase : Buffer : Acetonitrile = 83 : 17 Flow-rate : 1.2 ml/min Injection volume : 10µL Detection wavelength : 247nm Temperature : ambient temperature Run-time : 14min Table 2: Analysis of marketed formulation S.no Drug name Label claim Amount found % assay 1. Tigecycline 50 mg 50.75 mg 101.5% Table 3: System suitability for repeated injections for Tigecycline S.No Drug Name RT Area %Area Height 1 Tigecycline 7.639 2494924 100.00 501603 2 7.685 2500672 100.00 495816 3 7.687 2495912 100.00 494051 4 7.688 2500500 100.00 495121 5 7.694 2502202 100.00 495870 6 7.701 2501300 100.00 495392 Mean 2499252 SD 3045 %RSD 0.12 Table 4: Linearity parameters for tigecycline

  • S. No Conc. µg/ml Peak area
slide-12
SLIDE 12

MOL2NET, 2018, 4, http://sciforum.net/conference/mol2net-04 12 12

  • 1. 40 2038339
  • 2. 45 2300639
  • 3. 50 2564201
  • 4. 55 2814949
  • 5. 60 3066269

Table 5: Recovery studies for Tigecycline Inj. sample Spike level Amount present (µg/ml) Amount recovered (µg/ml) % Recovery Tigecycli ne 80% 40 40.25 100.62 100% 50 50.75 101.50 120% 60 60.38 100.63

slide-13
SLIDE 13

MOL2NET, 2017, 3, doi:10.3390/mol2net-03-xxxx 13 Table 6: Precision results for Tigecycline (INTRA-DAY AND INTER-DAY) Peak area of Tigecycline (INTRA-DAY) Peak area of Tigecycline (INTER-DAY) Injection-1 2568833 2502295 Injection-2 2564201 2494924 Injection-3 2538615 2492449 Injection-4 2545252 2503304 Injection-5 2540602 2510022 MEAN 2551501 2500599 STANDARD DEVIATION 14014.06 7028.771 % RSD 0.54% 0.28% Table 7: LOD and LOQ results for Tigecycline Sample LOD (µg/ml) LOQ (µg/ml) Tigecycline 1.8 5.42

Conclusion

A simple, specific, sensitive, isocratic RP-HPLC method was developed for the estimation of Tigecycline and in its pharmaceutical formulation. The peaks were well resolved with a good resolution factor. The method was precisely applied to the formulation and the results obtained were accurate and reproducible. The RP-HPLC was simple and does not suffer from common excipients in pharmaceutical preparation and highly useful in the analysis of drugs in pharmaceutical formulation

slide-14
SLIDE 14

MOL2NET, 2017, 3, doi:10.3390/mol2net-03-xxxx 14

References

[1] www.drugs.com. (2018). Tygacil. [Online]Available at: https://www.drugs.com/tygacil.html. [Accessed July 16, 2018]. [2] Chauhan AB, Patel DB. Area under the curve Spectrophotometric method for the determination of Tigecycline in Pharmaceutical Formulation. Journal of Pharmaceutical Science and Bioscientific

  • Research. 2012;2(2):88-91.

[3] Li C, Sutherland CA, Nightingale CH, Nicolau DP. Quantitation of tigecycline, a novel glycylcycline, by liquid chromatography. Journal of Chromatography B. 2004; 811(2):225-9. [4] da Silva LM, Salgado N, Regina H. Tigecycline: A Review of properties, Applications and Analytical methods. Therapeutic Drug Monitoring. 2010; 32(3):282-8. [5] Sunitha DA, Priyanka GH, J.Sujitha. Development and validation of stability indicating RP- HPLC method for the estimation of Tigecycline in Bulk and its parenteral dosage forms. World Journal of Pharmacy and Pharmaceutical sciences. 2017; 6(8):1096-107. [6] Lucélia Magalhães da Silva , Adélia Emilia de Almeida , Regina H, Salgado N. Thermal analysis and validation of UV-Visible spectrophotometric methods for the determination of New antibiotic Tigecycline in Pharmaceutical product. Advances in analytical

  • chemistry. 2012;2(1):10-5.

[7] Dinesh P, Digesh P, Parikh DKS. Stability Indicating RP-HPLC method development and its Validation for quantification of Tigecycline in Tigecycline lyophilized parenteral

  • preparation. International of Chemtech applications.2 (1):77-86.

[8] M ZK, N VG, V VE, T SA, A AH. Robust and sensitive High performance liquid chromatography UV detection technique for the determination of Tigecycline in Rabbit plasma. Journal of AOAC international. 2011; 94(3):847-56.