MOL2NET, 2017 , 3, doi:10.3390/mol2net-03-xxxx 2 years (N 2 O) [3]. - - PDF document

mol2net 2017 3 doi 10 3390 mol2net 03 xxxx 2
SMART_READER_LITE
LIVE PREVIEW

MOL2NET, 2017 , 3, doi:10.3390/mol2net-03-xxxx 2 years (N 2 O) [3]. - - PDF document

MOL2NET, 2017 , 3, doi:10.3390/mol2net-03-xxxx 1 MDPI MOL2NET, International Conference Series on Multidisciplinary Sciences http://sciforum.net/conference/mol2net-03 Assessment of Microclimatic conditions of St. Thomas University forest Kaden


slide-1
SLIDE 1

MOL2NET, 2017, 3, doi:10.3390/mol2net-03-xxxx 1

MDPI

MOL2NET, International Conference Series on Multidisciplinary Sciences http://sciforum.net/conference/mol2net-03

Assessment of Microclimatic conditions of St. Thomas University forest

Kaden Loring (E-mail: kloring@stu.edu ), David Quesada* (E-mail: dquesada@stu.edu ) School of Science, Technology, and Engineering Management, St. Thomas University, Miami Gardens, FL 33054, USA

* Corresponding author: David Quesada (E-mail: dquesada@stu.edu)

Graphical Abstract Abstract.

Urban meteorology and biometeorology have become very important fields nowadays due to the high rate of urbanization worldwide. Motivated by this situation this project is aimed at assessing the microclimatic conditions of St. Thomas University forest and evaluates the impact of canopy on the distribution on weather parameters within and around green areas as well as the extent of dispersal of pollutants from the Palmetto Expressway as a result of automobile exhausts. Observations from both, in campus Automated Weather Station (AWS) and mobile sensors (Xplorer from PASCO) are put together and mapped based on GIS information for points of measurements. The statistical analysis was done through the software R-Studio and packages for data visualization. As a result, a full characterization of soil and atmospheric conditions within the forest was done.

  • 1. Introduction

Starting from the second half of the 20th Century an increase in urbanization rates worldwide have been witnessed such that, around half of the world population lives now in urban areas [1] rather than in rural

  • communities. Therefore, the study of urban weather and climate is very important for urban health management.

Health forecasting might provide a reliable warning health care system that would facilitate the coverage and the quality of delivered services, as well as to address the problem of the increasing cost of medical care. The ability to anticipate episodes of medical outbreaks of any nature, as well as to properly manage the peak will facilitate taking the necessary steps during extreme events. In this context, the high load in services and resources in large urban areas impacts the quality of the environment through modification of the physical and chemical properties of the atmosphere and the covering of the soil surface [2]. The high burning of fossil fuels, the secondary pollution derived from automobile exhausts, industries and further chemical transformations have released into the atmosphere a considerable amount of Sulfur Dioxide (SO2), Carbon Monoxide (CO), Nitrous Oxides (NOx), Ozone (O3), Polycyclic Aromatic Hydrocarbons (PAH), secondary organic aerosols (SOA), and Particulate Matter of different sizes (PM2.5 and PM10), which taken combined pose a serious problem for human health. A further complication with all these chemicals and aerosols is coming from the variation of mixing ratios over time, a fact expressed quantitatively through the resident time. Resident times range from few minutes (NO3) to days (SO2, O3, aerosols) and even

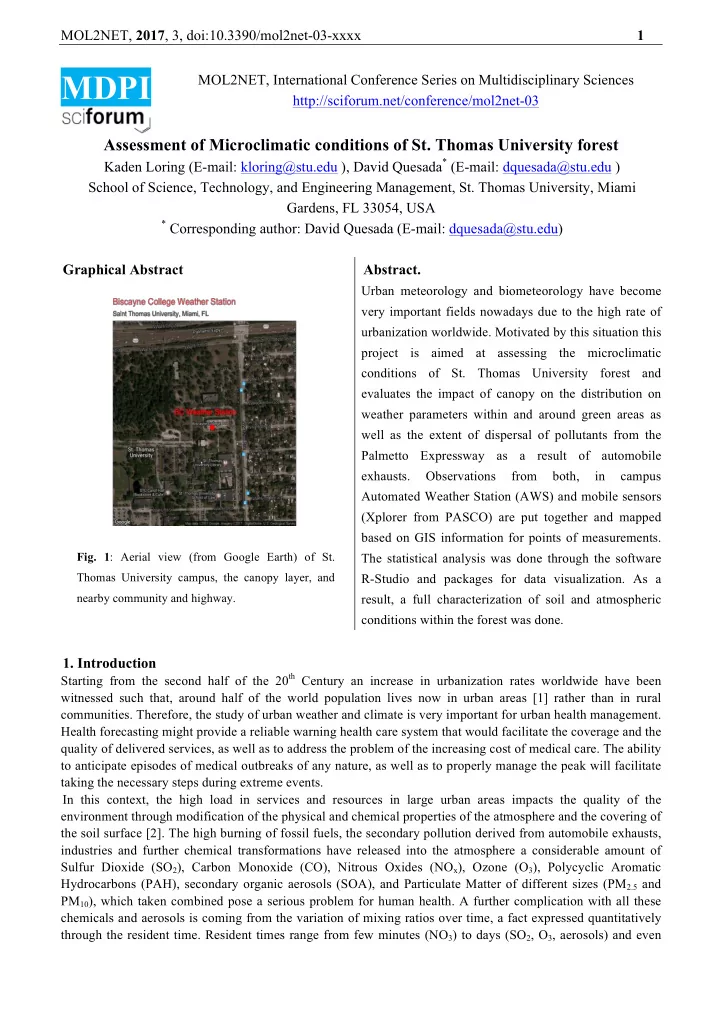
  • Fig. 1: Aerial view (from Google Earth) of St.

Thomas University campus, the canopy layer, and nearby community and highway.

slide-2
SLIDE 2

MOL2NET, 2017, 3, doi:10.3390/mol2net-03-xxxx 2

years (N2O) [3]. The extent of the influence also varies spatially; being the micro-scales and meso-scales the most relevant to issues related with urban health effects.

  • St. Thomas forest offers a unique opportunity as a test bed for the above-mentioned effects. It covers a land area

where both micro-meteorological and air quality effects might be observed. Its proximity to a highway (Palmetto –SR 826) in Metropolitan Miami allows observing the effect of diesel exhausts spread over nearby communities and the importance of a canopy layer on such dynamics (see Fig. 1).

  • 2. Data and Methods

Observations from both, in campus Automated Weather Station (AWS) running in partnership with Earth-Networks (Weatherbug) and mobile sensors (Xplorer from PASCO) are put together and mapped based on GIS information for points of measurements. The statistical analysis was done through the software RStudio and packages for data

  • visualization. The forest was divided into sections, such that data might

be gridded and comparison between different grids was performed (see

  • Fig. 2).

In a data set of nearly 28000 observations done from March 1 to June 4, 2017 field campaign, cleaning data properly and efficiently requires computational functions. To clean the weather station data, a combination of Boolean functions and graphical tests were used. The models were created with the help of R packages ggplot2, EBImage, and ggmap.

  • 3. Results and Discussion

The variation of temperature inside the forest is shown in Fig. 3 (a). As can be seen from Fig. 3 (a), temperatures are lower in the densest part of the forest, since the canopy layer blocks sunlight from reaching the ground. Ground level temperature measurements were performed every two hours from 10:00 am to 4:00 pm every day. Additionally, AWS recorded variations of air temperature every hour daily and year round. A comparison of both types of measurement was performed and rapid variations are

  • bserved

within forest, which are averaged when larger scales are considered. Wind direction and intensity reading from the AWS were mapped into a wind rose (Fig. 3 (b) – polar plot showing the directions from where most likely the wind is blowing from). During the period of analysis the wind pattern is most South-South-East (SSE). Therefore, most of the automobile exhausts from Palmetto expressway tend to spread towards the North-North-West (NNW). Another important component to look for is the volumetric water content which is a measure of soil The GLX device uses moisture. capacitance between two metal probes to measure the dielectric permittivity of sampled soil. Due to

Fig. 2: St. Thomas forest

  • bservational grids location.
  • Fig. 3: (a) Distribution of ground temperatures within the forest, (b) wind

rose, showing the prevalent winds and their intensity.

  • Fig. 4: (a) Average soil water

content, (b) Average relative humidity within the forest.

slide-3
SLIDE 3

MOL2NET, 2017, 3, doi:10.3390/mol2net-03-xxxx 3

water’s high dielectric compared to other materials within soil, the GLX will measure a significant change of capacitance in the presence of water. The percentage represents the amount of water compared to other soil

  • components. The choropleth (see Fig. 4 (a)) shows greater soil moisture in the densest forest areas. Urban

forests appear to reduce the risk of soil aridity by allowing greater runoff infiltration and reducing evaporation

  • f soil moisture due to canopy cover and organic floor cover. The effect of trees on increased humidity is shown

in Fig. 4 (b). Evapotranspiration from the trees releases water vapor into the surrounding atmosphere, which can have cooling effects. The regions with greatest humidity are also the coolest, which is related with the fact that low temperature allows more room for water molecules within the air. This phenomenon happens because a change in air temperature alters the air’s saturation vapor pressure. If the air temperature decreases, so does the air’s saturation vapor pressure. As the saturation vapor pressure approaches the actual vapor pressure, the relative humidity increases as the air approaches saturation [4]. It is noteworthy that the above picture is consistent with results from Fig. 3(a) and also the measurements of the UVA-light included in Fig. 5(b). All physical processes occurring within the canopy layer are schematically represented in Fig. 5 (a). The above discussed results have the potential to be guidance for the Urban Tree Project, aimed at developing sustainable smart urban environments, where canopies might help the cleaning of the air while support the cooling of the many urban areas preventing the excess of Urban Islands [5,6,7].

  • 4. Conclusions

Microclimate modeling can provide helpful insights across many disciplines. Understanding both natural and anthropogenic factors influencing local climate conditions through statistical modeling can aid in making decisions which might reduce climate change, reduce costly storm damage, and create healthier citizens. This research could be furthered developed with longer observation periods of current measurements and the additional measurements of carbon dioxide levels and transpiration levels by tree species.

Acknowledgments

Authors appreciate the support received from both, St. Thomas University and Miami Dade College, as wells as from the Department of Education grant P03C1160161 (STEM-SPACE).

References

  • 1. Grimm NB, et.al. Global change and the Ecology of cities, Science 319, 756 - 760, (2008)
  • 2. Bruse M, Assessing urban microclimate from the user's perspective and multi-agent systems as a new tool

in urban biometeorology, Ann. Meteorol. 41, 137 - 140 (2005); Changnon SA, Inadvertent weather modifications in urban areas: Lessons for global climate change, Bull. Amer. Meteor. Soc. 73, 619 - 627 (1992).

  • 3. Seinfeld JH, Pandis SN, Atmospheric Chemistry and Physics, Wiley 2nd Edition (2006).
  • 4. Ahrens CD, Essenstials of Meteorology, 7th Edition (2016).
  • 5. Hale RC, Gallo KP, Owen TW, and Loveland TR. Land use/land cover change effects on temperature

trends at U.S. Climate Normals stations, Geophys. Res. Lett., 33, L11703, doi:10.1029/2006GL026358 (2006).

  • 6. Livesley SJ, McPherson EG, and Calfapietra C, The Urban Forest and Ecosystem Services: Impacts on

Urban Water, Heat, and Pollution Cycles at the Tree, Street, and City Scale, J. Environ. Qual, 45, 119-124, doi: 10.2134/jeq2015.11.0567, (2016).

  • 7. Galderisi A, Climate Change Adaptation Challenges and Opportunities for a Smart Urban Growth, TeMA

Journal

  • f

Land Use, Mobility, and Environment, www.tema.unina.it/index.php/tema/article/view/2265/2342 (2014).

  • Fig. 5: (a) Schematic diagram showing physical processes within the

canopy layer, (b) UVA intensity within the forest.