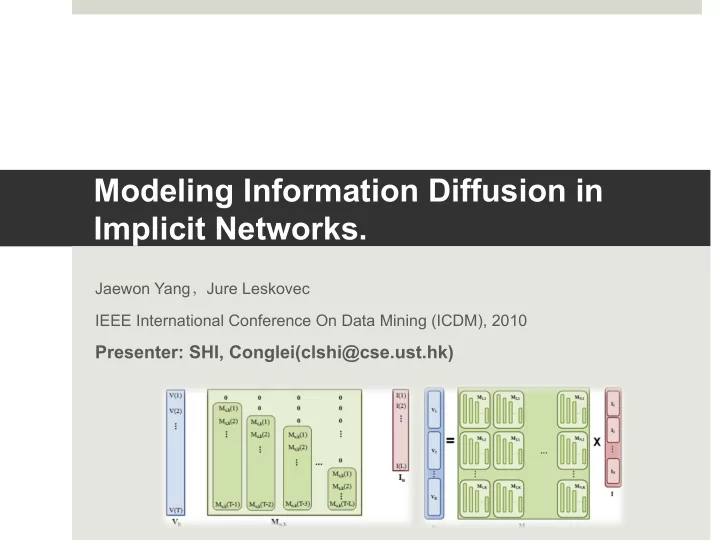
SLIDE 1 Modeling Information Diffusion in Implicit Networks.
Jaewon Yang,Jure Leskovec IEEE International Conference On Data Mining (ICDM), 2010
Presenter: SHI, Conglei(clshi@cse.ust.hk)
SLIDE 2
PROBLEM
¤ There are some limitations for parameter estimation:
¤ Need complete network data: FACT: Commonly , we only observe nodes got “infected”. ¤ Contagion can only spread over the edges: FACT: The diffusion is not just depend on the social network.
SLIDE 3
METHODS
¤ Focusing on modeling the global influence a node has on the rate of diffusion through the implicit network.
¤ Ignore the knowledge of the network ¤ Also model how the diffusion unfold over time.
¤ Proposed Linear Influence Model(LIM)
¤ Base Assumption: number of newly infected nodes depends on which other nodes got infected in the past.
SLIDE 4
LINEAR INFLUENCE MODEL
¤ V(t) : The number of nodes that mention the info at t ¤ I : The Influence of the node u at time t ¤ How to model ?
SLIDE 5
MODELING INFLUENCE FUNCTION
¤ Parametric approach:
¤ Too simplistic, assuming all the nodes follow the same form
¤ Non-parametric approach:
¤ Do not make any assumption about the shape of function ¤ Represent the function as a non-negative vector of length L ¤ Can study how the function varies for different types.
SLIDE 6
ESTIMATING FUNCTIONS
¤ Consider a set of N nodes, K contagions. ¤ Design an indicator function . If node u got infected by contagion k at time t, . ¤ : The number of nodes that got infected by k at time t.
SLIDE 7
ESTIMATING FUNCTIONS
SLIDE 8
ESTIMATING FUNCTIONS
SLIDE 9
ESTIMATING FUNCTIONS
¤ This problem is called Non-negative Least Squares(NNLS) problem ¤ The Matrix M is sparse in nature ¤ Using Reflective Newton Method is very effective. ¤ Tikhonov regularization is also applied to smooth the estimates. ¤ Minimize ¤ Subject to
SLIDE 10
EXTENSIONS
¤ Accounting for novelty:
¤ One node’s influence is related to the time it appears. ¤ Introduce a multiplicative factor . ¤ The equation is convex both and , which means we can use a coordinate descent procedure.
SLIDE 11
EXTENSIONS
¤ Accounting for imitation
¤ Some information diffusion is the effect of imitation. ¤ Introduce to model the latent volume. ¤ Also linear.
SLIDE 12
EXPERIMENTS
¤ First datasets
¤ Memetracker data: Extracting 343 million short textual phrases from 172 million news article and blog post. ¤ Time period: Sep.1 2008 to Aug. 31 2009 ¤ Choosing 1000 phrases with highest volume in a 5 day window around their peak volume
SLIDE 13 EXPERIMENTS
¤ Second datasets
¤ Twitter data: Identifying 6 million different hashtags from a stream
- f 580 million Twitter posts.
¤ Time period: Jun. 2009 to Feb. 2010 ¤ Choosing 1000 hashtags with highest volume in a 5 day window around their peak volume ¤ Grouping users into groups of 100 users.
SLIDE 14
EXPERIMENTS
¤ Evaluate LIM model on a time series prediction task. ¤ Employ 10-fold cross validation. ¤ Calculate ¤ Relative error is what we want.
SLIDE 15 RESULT
5.00% 7.00% 9.00% 11.00% 13.00% 15.00% 17.00% 19.00% 21.00% 23.00% 1 2 3 4 5 6 7 AR ARMA LIM B-LIM α-LIM
Yang, J., & Leskovec, J. Patterns of temporal variation in online media. (WSDM '11)
SLIDE 16 RESULT
- 27.00%
- 22.00%
- 17.00%
- 12.00%
- 7.00%
- 2.00%
3.00% 8.00% 13.00% 1 2 3 4 5 6 7
AR ARMA LIM B-LIM α-LIM AR+LIM
SLIDE 17
RESULT
SLIDE 18
RESULT
SLIDE 19
RESULT
SLIDE 20
RESULT
SLIDE 21
CONCLUSION
¤ Proposed the Linear Influence Model. ¤ Considered some other factors to enhance the model. ¤ Used large scale of data to justify the effectiveness of the model. ¤ Opened up a new framework for the analysis of diffusion.
¤ Future work: extend the linear model to non-linear model.
SLIDE 22
THANKS FOR YOUR ATTENTION!