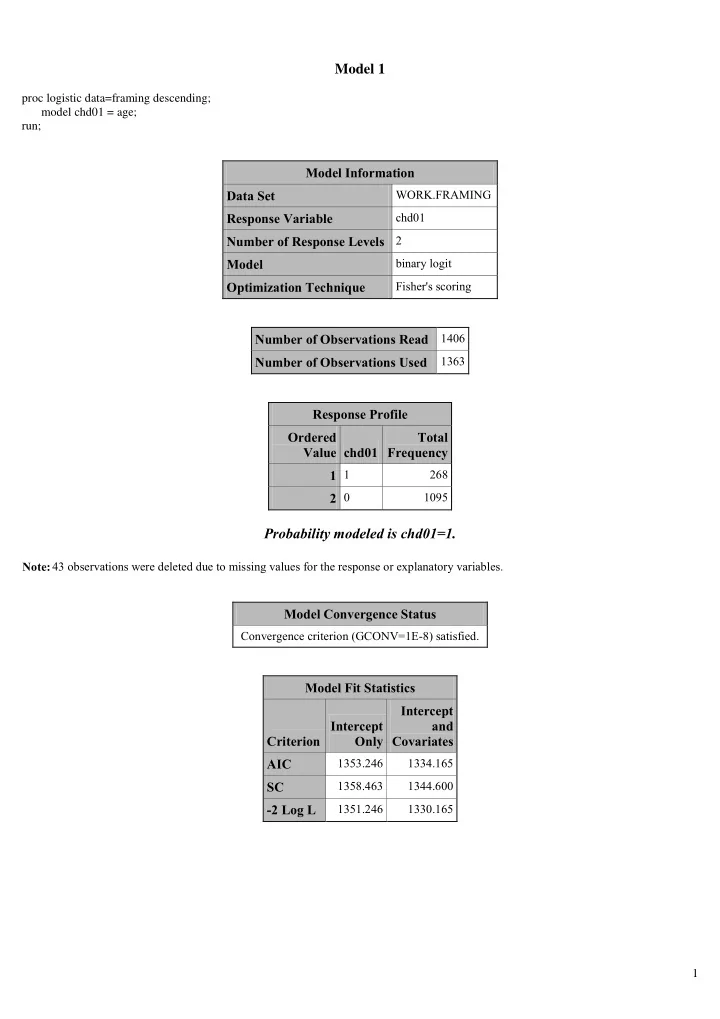
Model 1 proc logistic data=framing descending; model chd01 = age; - - PDF document

model 1
SMART_READER_LITE
LIVE PREVIEW

Model 1 proc logistic data=framing descending; model chd01 = age; - - PDF document

Model 1 proc logistic data=framing descending; model chd01 = age; run; Model Information Data Set WORK.FRAMING Response Variable chd01 Number of Response Levels 2 Model binary logit Optimization Technique Fisher's scoring Number of


slide-1
SLIDE 1

1

Model 1

proc logistic data=framing descending; model chd01 = age; run;

Model Information Data Set

WORK.FRAMING

Response Variable

chd01

Number of Response Levels 2 Model

binary logit

Optimization Technique

Fisher's scoring

Number of Observations Read 1406 Number of Observations Used

1363

Response Profile Ordered Value chd01 Total Frequency 1 1

268

2 0

1095

Probability modeled is chd01=1.

Note: 43 observations were deleted due to missing values for the response or explanatory variables.

Model Convergence Status

Convergence criterion (GCONV=1E-8) satisfied.

Model Fit Statistics Criterion Intercept Only Intercept and Covariates AIC

1353.246 1334.165

SC

1358.463 1344.600

  • 2 Log L

1351.246 1330.165

slide-2
SLIDE 2

2

Testing Global Null Hypothesis: BETA=0 Test Chi-Square DF Pr > ChiSq Likelihood Ratio

21.0810 1 <.0001

Score

21.0467 1 <.0001

Wald

20.6991 1 <.0001

Analysis of Maximum Likelihood Estimates Parameter DF Estimate Standard Error Wald Chi-Square Pr > ChiSq Intercept

1

  • 4.8843

0.7737 39.8507 <.0001

age

1 0.0658 0.0145 20.6991 <.0001

Odds Ratio Estimates Effect Point Estimate 95% Wald Confidence Limits age

1.068 1.038 1.099

Association of Predicted Probabilities and Observed Responses Percent Concordant

56.2 Somers' D 0.181

Percent Discordant

38.1 Gamma 0.192

Percent Tied

5.7 Tau-a 0.057

Pairs

293460 c 0.590

slide-3
SLIDE 3

3

Model 2

proc logistic data=framing descending; model chd01 = age age*age; run;

Model Information Data Set

WORK.FRAMING

Response Variable

chd01

Number of Response Levels 2 Model

binary logit

Optimization Technique

Fisher's scoring

Number of Observations Read 1406 Number of Observations Used

1363

Response Profile Ordered Value chd01 Total Frequency 1 1

268

2 0

1095

Probability modeled is chd01=1.

Note: 43 observations were deleted due to missing values for the response or explanatory variables.

Model Convergence Status

Convergence criterion (GCONV=1E-8) satisfied.

slide-4
SLIDE 4

4

Model Fit Statistics Criterion Intercept Only Intercept and Covariates AIC

1353.246 1336.164

SC

1358.463 1351.816

  • 2 Log L

1351.246 1330.164

Testing Global Null Hypothesis: BETA=0 Test Chi-Square DF Pr > ChiSq Likelihood Ratio

21.0815 2 <.0001

Score

21.2273 2 <.0001

Wald

20.7181 2 <.0001

Analysis of Maximum Likelihood Estimates Parameter DF Estimate Standard Error Wald Chi-Square Pr > ChiSq Intercept

1

  • 4.6723

9.0295 0.2677 0.6048

age

1 0.0577 0.3424 0.0284 0.8661

age*age

1 0.000076 0.00323 0.0006 0.9812

Association of Predicted Probabilities and Observed Responses Percent Concordant

56.2 Somers' D 0.181

Percent Discordant

38.1 Gamma 0.192

Percent Tied

5.7 Tau-a 0.057

Pairs

293460 c 0.590