MiniBooNE beam simulation Kendall Mahn on behalf of those who did - - PowerPoint PPT Presentation

miniboone beam simulation
SMART_READER_LITE
LIVE PREVIEW

MiniBooNE beam simulation Kendall Mahn on behalf of those who did - - PowerPoint PPT Presentation

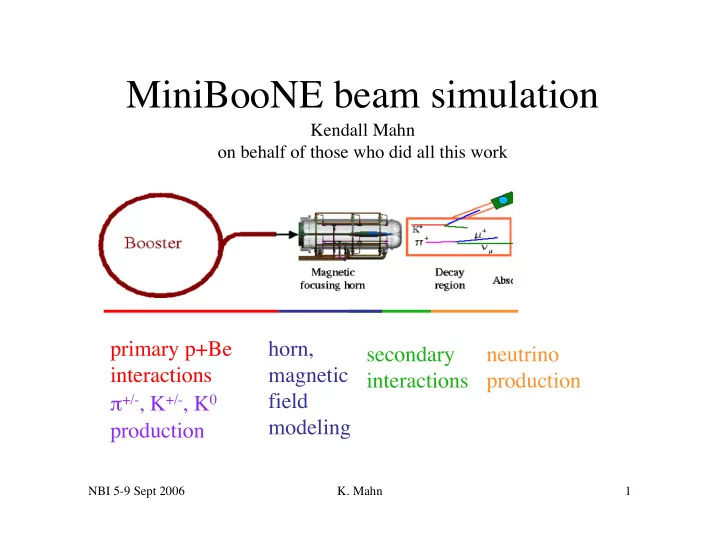
MiniBooNE beam simulation Kendall Mahn on behalf of those who did all this work primary p+Be horn, secondary neutrino interactions magnetic interactions production field +/- , K +/- , K 0 modeling production NBI 5-9 Sept 2006 K.


slide-1
SLIDE 1

NBI 5-9 Sept 2006

  • K. Mahn

1

MiniBooNE beam simulation

Kendall Mahn

  • n behalf of those who did all this work

primary p+Be interactions horn, magnetic field modeling π+/-, K+/-, K0 production secondary interactions neutrino production

slide-2
SLIDE 2

NBI 5-9 Sept 2006

  • K. Mahn

2

primary p+Be interactions horn current, magnetic field modeling π+/-, K+/-, K0 production secondary interactions neutrino production

slide-3
SLIDE 3

NBI 5-9 Sept 2006

  • K. Mahn

3

Primary (p+Be) interactions

Proton beam and target

Beam protons produced around a mean position, angle, with gaussian smearing

central values of position, angle and spread (positional and directional) based on beam position monitor information

Be target 7 “slugs” make a total of 1.7 interaction lengths

Target material, shape (including cooling fins) included in simulation

slide-4
SLIDE 4

NBI 5-9 Sept 2006

  • K. Mahn

4

Primary (p+Be) interactions

Beam Optics

Varying spread of beam in target changes the relative efficiency of an interaction by 1% relative efficiency is how often a proton will or won’t interact, roughly corresponds to how much the flux can change Considered “pin” beam (no divergence or spread), perfectly focused beam, and different focus points

slide-5
SLIDE 5

NBI 5-9 Sept 2006

  • K. Mahn

5

Primary (p+Be) interactions

Proton beam

  • Absolute proton on target (p.o.t.) measured by two

toroids upstream of the target

– Two toroids measurements track each other well – Toroid drift main contributor to error – 3% total error on delivered p.o.t before March 2003, since then 1.7% target/horn toroid 2 toroid 1 beam position monitors p from Booster

slide-6
SLIDE 6

NBI 5-9 Sept 2006

  • K. Mahn

6

Primary (p+Be) interactions

p+Be cross sections

Protons then interact with the target, and either scatter or react to produce a meson σ total = σ elastic + σ inelastic

σ inelastic = σ quasi-elastic + σ reaction

p+Be-> p+... p+Be-> π,K+....

slide-7
SLIDE 7

NBI 5-9 Sept 2006

  • K. Mahn

7

Primary (p+Be) interactions

p+Be cross sections

Measurements for σ total , σ inelastic

320mb 290mb 205mb 215mb

σ inelastic = 212.4+/-5mb σ total = 285+/-15mb ⇒1% change in reaction efficiency

slide-8
SLIDE 8

NBI 5-9 Sept 2006

  • K. Mahn

8

Primary (p+Be) interactions

p+Be cross sections

σtotal = σ elastic + σ inelastic

σ inelastic = σ quasi-elastic + σ reaction

Model dependent quantities:

σelastic range constrained by σ total and σ inelastic => 1% Variation of 30 mb for σ quasi-elastic => 2.5% Kinematic variation in model

More forward going events see more target, material

=> <1% change for σ elastic, 2% for σ quasi-elastic Measure σ reaction with differential cross sections

slide-9
SLIDE 9

NBI 5-9 Sept 2006

  • K. Mahn

9

primary p+Be interactions horn current, magnetic field modeling π+/-, K+/-, K0 production secondary interactions neutrino production

slide-10
SLIDE 10

NBI 5-9 Sept 2006

  • K. Mahn

10

Primary (p+Be) interactions

Differential cross sections of π,K

Various experiments have measured how often protons react to produce π,K However, such data sets vary across proton beam energy, meson angle and momentum, as well as incident targets => Fit the differential cross section data sets with a parameterization function Use of a parameterization allows for comparisons between data sets, as well as combining different data sets into one

slide-11
SLIDE 11

NBI 5-9 Sept 2006

  • K. Mahn

11

Primary (p+Be) interactions

Sanford-Wang (S-W) Parametrization

MiniBooNE uses Sanford-Wang parametrization for the π,K fits

  • Given the proton beam momentum (pbeam) and meson lab frame

momentum (p) and angle (θ ), can fit to data using c1-c9

  • Function based on Feynman scaling

d2σ(p+A->π++X) = c1pc2(c9-p/pbeam) exp[-c3 (pc4/pbeam

c5) -c6θ(p-c7pbeam cosc8 θ) ]

(p,θ) dp dΩ

  • c9 represents mass threshold for kaons (=1 for pions)

Errors are calculated based on the allowed 1σ variations in the ci ; ci correlations are included

slide-12
SLIDE 12

NBI 5-9 Sept 2006

  • K. Mahn

12

π+ external data

  • Combined S-W fit to preliminary HARP 8.9 GeV and E910

6.4,12.3 GeV datasets

– HARP is at correct beam energy, E910 provides some of the smallest angular bins

  • E910 and HARP have similar normalization, some difference in

shape of fits

  • Fit pre-HARP is consistent with current fit including HARP
slide-13
SLIDE 13

NBI 5-9 Sept 2006

  • K. Mahn

13

π+ external data

HARP (preliminary) 8.9 GeV Combined S-W fit E910 12.3 GeV pπ(GeV/c)

d2 σ / d p d Ω ( m b / G e V / c / s t r )

slide-14
SLIDE 14

NBI 5-9 Sept 2006

  • K. Mahn

14

K+ external data

  • Currently use Aleshin,

Abbot, Eichten Eichten and Vorontsov data

  • K+ flux shape fixed by

fit, normalization determined by beam data

– LMC, high E νµ

  • HARP will make a

measurement of kaon production on Be in the next year x F p

T

(GeV/C)

high E νµ LMC

slide-15
SLIDE 15

NBI 5-9 Sept 2006

  • K. Mahn

15

K0 external data

  • K0 data sets: E910 12.3,17.6,

Abe 12 GeV/c

– Other data sets exist (Eisner, 6.0 GeV/c, Blobel, 12,24 GeV/c) but p-p not p-Be

θ

k a

  • n

(rad) p

k a

  • n

( G e V / C )

slide-16
SLIDE 16

NBI 5-9 Sept 2006

  • K. Mahn

16

  • S-W fit constrains K0 to

26% level

  • K0 normalization and

shape are set by this fit

– K0 νe s only compose <10% of c1 sample

θ

k a

  • n

(rad) p

k a

  • n

( G e V / c )

K0 external data

S-W fit ------- E910 12.3, 17.6, Abe

d2 σ / d p d Ω ( m b / G e V / c / s t r )

slide-17
SLIDE 17

NBI 5-9 Sept 2006

  • K. Mahn

17

primary p+Be interactions horn current, magnetic field modeling π+/-, K+/-, K0 production secondary interactions neutrino production

slide-18
SLIDE 18

NBI 5-9 Sept 2006

  • K. Mahn

18

Magnetic horn

Horn is pulsed at 174 kA for 141µs Geometry in Geant3 (converted to Geant4)

take data

slide-19
SLIDE 19

NBI 5-9 Sept 2006

  • K. Mahn

19

Horn current

  • Absolute current

measurement of 174 kA

– value measured by current transformers to 0.5% level – => consider variations of +/- 1kA – Most effect at high energy

  • Horn current pulse timing

– Horn pulse peak arrives when protons do

– Current delivery timing is stable over time

days horn current

173 kA 175 kA

slide-20
SLIDE 20

NBI 5-9 Sept 2006

  • K. Mahn

20

Horn

Electromagnetic field model

  • In a perfect conductor, the magnetic field does not enter the

conductor

  • In reality, the field can be nonzero into the surface of the

conductor, this is called “the skin depth effect” Target

current current

B ~ 1/r Perfect! Realistic Outer conductor Inner conductor Target B ~ 1/r Outer conductor Inner conductor

slide-21
SLIDE 21

NBI 5-9 Sept 2006

  • K. Mahn

21

Horn

Electromagnetic field model

  • Measurements of

MiniBooNE horn across voltage, radius consistent w/ 1/r

  • Measured field on the

inner surface of conductor

  • n NuMI horn to be small
  • Field penetration (modeled

as an exponential decay) in conductor has no substantial effect on normalization ~1/r r (cm) B(T)

inner conductor

slide-22
SLIDE 22

NBI 5-9 Sept 2006

  • K. Mahn

22

primary p+Be interactions horn current, magnetic field modeling π+/-, K+/-, K0 production secondary interactions neutrino production

slide-23
SLIDE 23

NBI 5-9 Sept 2006

  • K. Mahn

23

Secondary Interactions

  • Changing the secondary production

models has a minimal effect on the neutrino flux

– GHEISHA, Bertini, Binary cascade models similar

  • HARP has the ability to measure

both proton and meson interactions

  • n Be
  • Thick target data will check current

model as well

17% of all protons interact twice 7% of νµ come from p-> p -> π Additionally, pions and kaons can interact with the horn, target or concrete

slide-24
SLIDE 24

NBI 5-9 Sept 2006

  • K. Mahn

24

primary p+Be interactions horn current, magnetic field modeling π+/-, K+/-, K0 production secondary interactions neutrino production

slide-25
SLIDE 25

NBI 5-9 Sept 2006

  • K. Mahn

25

Meson decay to neutrinos

  • Mesons don’t always decay to neutrinos (absorption,

scattering); neutrinos don’t always hit our detector

  • To help boost statistics, we use “redecay”

– Every meson that decays to a neutrino is saved – It is decayed ~1000s of times with the same meson momentum, position and decay mode

  • Muon polarization is taken into account
  • Neutrino’s position, direction is maintained when it interacts at detector
  • More events are produced for sparse kinematic regions, but

with a corresponding lower weight

– Statistics can cause fluctuations which redecay can amplify

  • One pion producing a neutrino at 7 GeV, but no neutrinos from pions of

slightly different momentum, angle, now there’s 1000 of them

– Deweight events after redecay to produce a smooth flux

slide-26
SLIDE 26

NBI 5-9 Sept 2006

  • K. Mahn

26

? Lots of work put into understanding the primary parts of neutrino production

–Hadron production by HARP extremely valuable

A neutrino flux only has meaning with an associated error and scale of that error – absolute p.o.t, beam optics, p+Be cross sections, Sanford-Wang parametrization, horn current, skin depth, secondary interactions and geometry all considered –Still working!

slide-27
SLIDE 27

NBI 5-9 Sept 2006

  • K. Mahn

27

Geometry of beamline

  • Distance from target/horn to detector verified by:

– surveyors – walking – driving – Google Maps

  • Only “large” (noticable) shifts would produce a significant effect on the flux

– Shifting the target by 23 cm -> 8% change in flux – Shifting collimator by 1 m further down -> 1% change in flux – Increasing decay pipe diameter by 4 inches -> 4% change in flux – Increasing the length of the horn by 10cm -> 1% change in flux

slide-28
SLIDE 28

NBI 5-9 Sept 2006

  • K. Mahn

28

References

  • Toroid calibration/checks: J. Monroe thesis
  • Sanford-Wang parameterization: J. R. Sanford and C.L.Wang “Empirical

formulas for particle production in p-Be collisions between 10 and 35 BeV/c”, Brookhaven National Laboratory, AGS internal report, (1967) (unpublished)

  • p+Be cross sections (total)

– Bellettini et al., Nucl. Phys. 79 (1966) 609-624

  • p+Be cross sections (inelastic)

– V. V. Gachurin et al., ITEP-59-1985 – B.M. Bobchenko et al., Sov. J. Nucl. Phys. 30, 805 (1979) [Yad. Fiz. 30, 1553 (1979)].

  • E910, HARP: publications in progress