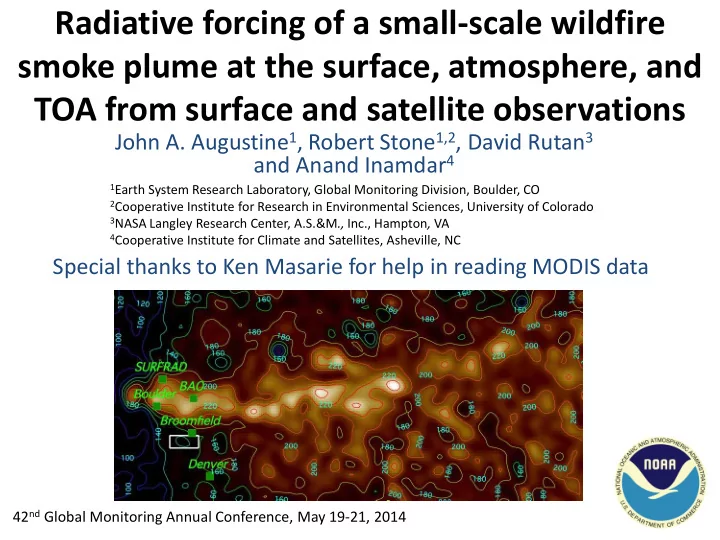

Radiative forcing of a small-scale wildfire smoke plume at the surface, atmosphere, and TOA from surface and satellite observations John A. Augustine 1 , Robert Stone 1,2 , David Rutan 3 and Anand Inamdar 4 1 Earth System Research Laboratory, Global Monitoring Division, Boulder, CO 2 Cooperative Institute for Research in Environmental Sciences, University of Colorado 3 NASA Langley Research Center, A.S.&M ., Inc., Hampton , VA 4 Cooperative Institute for Climate and Satellites, Asheville, NC Special thanks to Ken Masarie for help in reading MODIS data 42 nd Global Monitoring Annual Conference, May 19-21, 2014
NASA Terra MODIS imager 1820 UTC, ~ 2 hours after the fire started Southern Wyoming Denver
Met station M34 Met station M23 N Longmont SURFRAD E Sfc. radiation budget, AOD Sfc. radiation budget, AOD, BAO Burn Ceilometer Area Erie GPS H 2 O Boulder GPS GPS 10 km GPS NOAA Louisville AOD, optical properties Broomfield Met station M19
Our focus is to compute the total Radiative Forcing (RF) and Efficiency (RFE) of the smoke aerosol at the surface, atmosphere, and TOA RFE (sfc or TOA) = ∆ net Rad (sfc or TOA) / τ 500nm RFE atmos = RFE TOA - RFE sfc • Computed for SW, LW, and all-wave • RFE SW dependent on solar zenith angle and surface albedo • RFE LW dependent on the thermal structure of the atmosphere, water vapor, and skin temperature
Clear-sky surface measurements throughout the day allowed direct calculation of RFE sfc Net SW (Wm -2 ) Net LW (Wm -2 ) Total Net (Wm -2 )
Satellite data is necessary to compute aerosol radiative forcing at TOA • CERES broadband imagers (20 km res.) could not resolve the Fourmile Canyon fire smoke plume • MODIS spectral imagers (1 km res.) could resolve the plume, but NASA does not do a narrowband-to-broadband conversion
MODIS Spectral radiance to broadband conversion SW: Tang et al. [2006], Remote Sensing Environment r = b 0 + ρ 1 b 1 + ρ 2 b 2 + ρ 3 b 3 + ρ 4 b 4 + ρ 5 b 5 + ρ 6 b 6 + ρ 7 b 7 r = broadband shortwave reflectance b i = c1 i + [c2 i /(1+exp((1/cos(VZA)-c3 i /c4 i )) ρ i = π L i d 2 /Eo i cos(SZA) L i upwelling radiance for MODIS channel i RMS error = 0.01 LW: Inamdar and French [2009], AMS Conference LW TOA = a 0 + a 1 L 11 + a 2 L 12 + a 3 w L 11 and L 12 are MODIS 11 and 12 µ m radiance w is the MODIS integrated water vapor product
LW narrowband to broadband model calibrated to CERES data for one week surrounding the event CERES
Surface AOD measurements at BAO and SURFRAD Aqua Terra Background AOD before fire began
Terra SW broadband reflectance at 18:20 UTC RMS=0.01 SW TOA = r [1361*cos(SZA)/d 2 ]
Aqua SW broadband reflectance at 20:00 UTC
Terra broadband longwave at 18:20 UTC
Aqua broadband longwave at 20:00 UTC
LW Radiative Forcing Efficiency at TOA
RF Results ( SZA~ 35°, sfc. albedo = 0.15) SW τ 500 Sfc RF SW TOA RF SW Atmos.RF SW Atmos. heating (°K/day) 1820 UTC SURFRAD 0.057 -0.6 Wm -2 BAO 3.37 - 512 Wm -2 -113 Wm -2 +399 Wm -2 +12.6 (±0.6) 2000 UTC SURFRAD 1.37 -255 Wm -2 -58 Wm -2 +197 Wm -2 +8.4 (±0.6) BAO 1.23 -187 Wm -2 -75 Wm -2 +112 Wm -2 +6.5 (±0.6) LW τ 500 Sfc RF LW TOA RF LW Atmos.RF LW Atmos. heating (°K/day) 1820 UTC SURFRAD 0.057 +0.4 Wm -2 BAO 3.37 +34 Wm -2 +24 Wm -2 -10 Wm -2 -4.2 (±0.3) 2000 UTC SURFRAD 1.37 +19 Wm -2 +10 Wm -2 -6 Wm -2 -2.9 (±0.3) BAO 1.23 +12 Wm -2 +9 Wm -2 -3 Wm -2 -4.0 (±0.3)
MODIS integrated water vapor at 08:50 UTC, 6 Sept. 2010 ~ 8 hours before the fire started
MODIS integrated water vapor at 20:00 UTC, 6 Sept. 2010 ~ 3 hours after the fire started Plume area shows a 1.0 – 1.5 mm increase in integrated water vapor over 3 hours due to combustion alone
Summary and Conclusions • MODIS narrowband to broadband conversion models appear to work well for both the SW and LW • SW cooling at the surface is 3-4 times greater than at TOA • Smoke aerosols warm the surface in the LW, but that warming is overwhelmed by SW cooling (15 times greater in magnitude) • At TOA, the magnitude of SW cooling is 4 to 10 times greater than the magnitude of LW heating at TOA • Atmospheric cooling by the LW offsets the greater SW warming by about one third—thus, LW effects need to be considered when modeling the “semi-direct aerosol effect on clouds” • Using MODIS water vapor product, we were able to quantify the increase in integrated water vapor by the burning biomass—1.0 to 1.5 mm over three hours
Recommend
More recommend