
SLIDE 1
1
1
MINERAL COMMODITIES LTD GLOBAL OVERVIEW
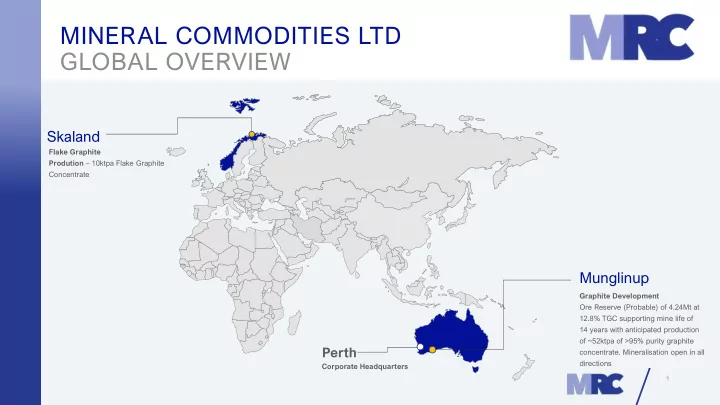
Munglinup Skaland
Perth
Corporate Headquarters Flake Graphite Prodution – 10ktpa Flake Graphite Concentrate Graphite Development Ore Reserve (Probable) of 4.24Mt at 12.8% TGC supporting mine life of 14 years with anticipated production
- f ~52ktpa of >95% purity graphite
- concentrate. Mineralisation open in all
directions
1