
SLIDE 1
Milk Avoidance and Milk Alternatives
Dennis Savaiano, PhD Virginia C. Meredith Professor of Nutrition Science Purdue University savaiano@purdue.edu
The traditional dogma:
- Lactose maldigesters are lactose intolerant
- They need to avoid milk
- Use digestive aids
- Take supplements
- Eat low lactose alternatives
- Don’t worry about lower calcium intakes and
poor bone health
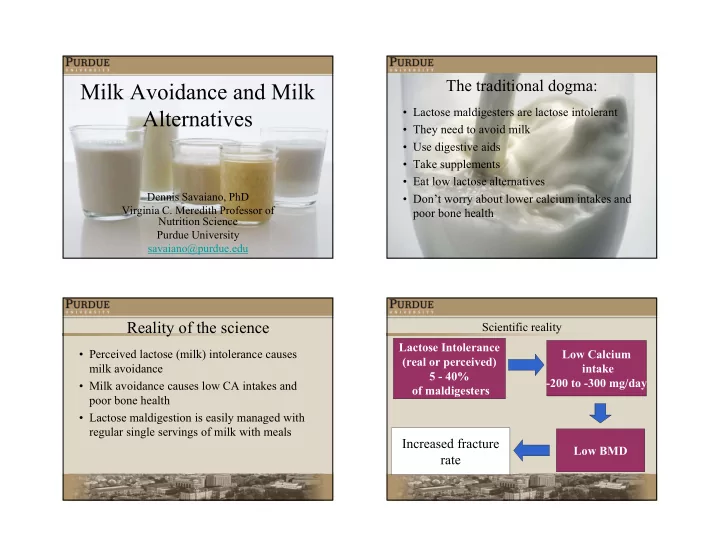
Reality of the science
- Perceived lactose (milk) intolerance causes
milk avoidance
- Milk avoidance causes low CA intakes and
poor bone health
- Lactose maldigestion is easily managed with
regular single servings of milk with meals
Increased fracture rate
Lactose Intolerance (real or perceived) 5 - 40%
- f maldigesters
Low Calcium intake
- 200 to -300 mg/day