Metocean reducing risk in Construction Projects Mark Calverley - - PowerPoint PPT Presentation

metocean reducing risk in construction projects
SMART_READER_LITE
LIVE PREVIEW

Metocean reducing risk in Construction Projects Mark Calverley - - PowerPoint PPT Presentation

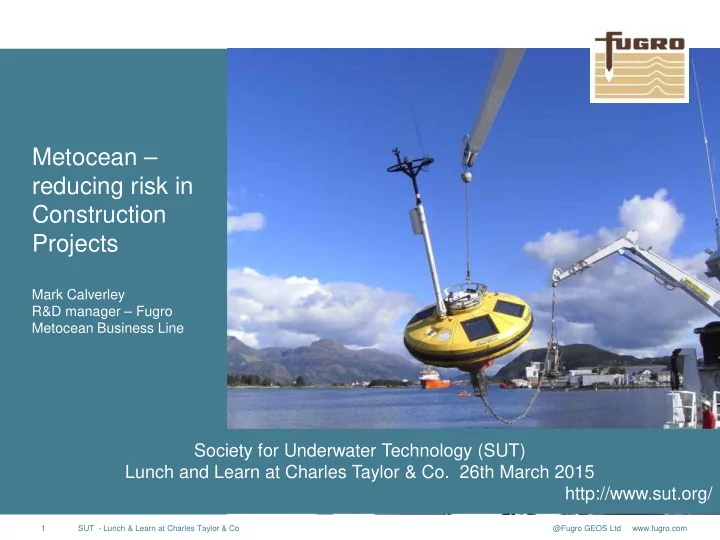
Metocean reducing risk in Construction Projects Mark Calverley R&D manager Fugro Metocean Business Line Society for Underwater Technology (SUT) Lunch and Learn at Charles Taylor & Co. 26th March 2015 http://www.sut.org/ 1


slide-1
SLIDE 1

1 @Fugro GEOS Ltd www.fugro.com

Society for Underwater Technology (SUT) Lunch and Learn at Charles Taylor & Co. 26th March 2015 http://www.sut.org/

SUT - Lunch & Learn at Charles Taylor & Co

Metocean – reducing risk in Construction Projects

Mark Calverley R&D manager – Fugro Metocean Business Line

slide-2
SLIDE 2

2 @Fugro GEOS Ltd www.fugro.com

Outline

SUT - Lunch & Learn at Charles Taylor & Co

General Introduction

  • Considerations
  • Uncertainties

Planning Execution Analysis

slide-3
SLIDE 3

3 @Fugro GEOS Ltd www.fugro.com

Measurement Considerations

SUT - Lunch & Learn at Charles Taylor & Co

Instrument Choice Sampling Strategy Installation Regional Oceanography Metocean Data Requirements Metocean Data Analysis Engineering Schedule Operations Marine Warranty / Legislation

Engineering Metocean Measurements

slide-4
SLIDE 4

4 @Fugro GEOS Ltd www.fugro.com

Hindcast Model reliability (atmospheric, waves, currents) Analysis Methods Response modelling Metocean processes not represented in models (temporal or spatially) Forecast Model reliability (atmospheric, waves, currents) Metocean Awareness Measurement QA

Where do the uncertainties lies?

SUT - Lunch & Learn at Charles Taylor & Co

slide-5
SLIDE 5

5 @Fugro GEOS Ltd www.fugro.com

Planning Data to support operational planning. Ways to characterise Metocean conditions for operational planning. Forecast considerations. Transport / Execution Ways to forecast / measure Metocean conditions for

  • perational planning.

Analysis Quantification of downtime, Accuracy of forecasts, etc.

Metocean across the phases

SUT - Lunch & Learn at Charles Taylor & Co

slide-6
SLIDE 6

6 @Fugro GEOS Ltd www.fugro.com

Areas of Uncertainty

  • Hindcast Model reliability (atmospheric, waves,

currents)

  • Analysis Methods
  • Response modelling
  • Metocean processes not represented in models

(temporal or spatially) DNV Guidance note: For meteorological and oceanographic data a minimum of three to four years of data collection is recommended. Planning generally based on hindcast data:

  • Temporal and spatial resolution
  • Validation / verification

Planning

SUT - Lunch & Learn at Charles Taylor & Co

slide-7
SLIDE 7

7 @Fugro GEOS Ltd www.fugro.com

Temporal Considerations

SUT - Lunch & Learn at Charles Taylor & Co

What is the temporal resolution of the model data?

  • 1-hourly
  • 3-hourly
  • 6-hourly

What are the time scales of the Metocean processes? Some processes not well represented in models include:

  • Squalls
  • Solitons
  • Polar lows

Use of complementary data, e.g. satellite data.

slide-8
SLIDE 8

8 @Fugro GEOS Ltd www.fugro.com

Temporal Considerations

SUT - Lunch & Learn at Charles Taylor & Co

What is the temporal resolution of the model data?

  • 1-hourly
  • 3-hourly
  • 6-hourly

What are the time scales of the Metocean processes? Some processes not well represented in models include:

  • Squalls
  • Solitons
  • Polar lows

Use of complementary data, e.g. satellite data.

slide-9
SLIDE 9

9 @Fugro GEOS Ltd www.fugro.com

Temporal Considerations

SUT - Lunch & Learn at Charles Taylor & Co

What is the temporal resolution of the model data?

  • 1-hourly
  • 3-hourly
  • 6-hourly

What are the time scales of the Metocean processes? Some processes not well represented in models include:

  • Squalls
  • Solitons
  • Polar lows

Use of complementary data, e.g. satellite data.

slide-10
SLIDE 10

10 @Fugro GEOS Ltd www.fugro.com

Model resolution

Spatial Considerations

SUT - Lunch & Learn at Charles Taylor & Co

slide-11
SLIDE 11

11 @Fugro GEOS Ltd www.fugro.com

Model resolution

Spatial Considerations

SUT - Lunch & Learn at Charles Taylor & Co

slide-12
SLIDE 12

12 @Fugro GEOS Ltd www.fugro.com

Do the models domains extend, at appropriate resolution, to topography / coastlines that might drive the wind forcing?

Spatial Considerations

Can the models capture the spatial scales of the Metocean

  • processes. For example polar lows.

During planning can you rely on the geographic registration of frontal features?

SUT - Lunch & Learn at Charles Taylor & Co

slide-13
SLIDE 13

13 @Fugro GEOS Ltd www.fugro.com

Cost impact of choice of analysis

Assume an operation west of Shetland with £250k day rate. 1. Joint frequency distribution based on 4m threshold on significant wave height. 2. Joint frequency distribution based on 4m threshold on significant wave height and peak period below 10s 3. Persistence based on significant wave height and 18 hour duration. 4. Weather windows analysis based on

  • 18-hour duration
  • Operational threshold = 4m, Tp > 10s; 2.5m, Tp < 2.5s

SUT - Lunch & Learn at Charles Taylor & Co

slide-14
SLIDE 14

14 @Fugro GEOS Ltd www.fugro.com

Metocean Awareness?

SUT - Lunch & Learn at Charles Taylor & Co

slide-15
SLIDE 15

15 @Fugro GEOS Ltd www.fugro.com

Cost / downtime with Analysis

August September Analysis Hs =4m Hs=4m, Tp<10s Hs=4, Durn>18hr Downtime days August 0.45 8.2 0.10 September 3.47 18.62 4.13 Downtime cost August 112,375 2,056,452 24,800 September 868,500 4,656,458 1,031,250 Sep-Aug 756,125 2,600,006 1,006,450 WOW (hours) Weather cost (£) August September Average 1.9 8.0 20,060 83,177 Maximum 54.0 96.0 562,500 1,000,000 P10 6.0 30.0 62,500 312,500 P20 0.0 12.0

  • 125,000

P30 0.0 0.0

  • SUT - Lunch & Learn at Charles Taylor & Co
slide-16
SLIDE 16

16 @Fugro GEOS Ltd www.fugro.com

  • Know your regional Metocean conditions.
  • Know your installation’s dependence on the Metocean conditions, what

are the limiting processes.

  • Know your data sources. Free is good but is it fit for purpose?
  • Know your analysis techniques.

Planning Summary

SUT - Lunch & Learn at Charles Taylor & Co

slide-17
SLIDE 17

17 @Fugro GEOS Ltd www.fugro.com

Fatigue potential is high. Directly measure fatigue. Compare Metocean design conditions of transport to those experienced. Identify potential issues for inspection prior to installation.

Transport

SUT - Lunch & Learn at Charles Taylor & Co

slide-18
SLIDE 18

18 @Fugro GEOS Ltd www.fugro.com

Forecast Reliability Measurements Response Modelling

Execution

Metocean Awareness

SUT - Lunch & Learn at Charles Taylor & Co

slide-19
SLIDE 19

19 @Fugro GEOS Ltd www.fugro.com

Forecast (Model) Reliability

Weather Forecast Level Meteorologist rqd.

  • n site

Independent WF source Maximum WF interval A Yes(1) 2(2) 12 hours(3) B No(4) 2(5) 12 hours C No 1 12 hours

1. There should be a dedicated meteorologist, but it may be acceptable that he/she is not physically present at site. The meteorologist opinion regarding his preferable location should be duly

  • considered. It is anyhow mandatory that the dedicated meteorologist has continuous access to

weather information from the site and that he/she is familiar with any local phenomena that may influence the weather conditions. 2. It is assumed that the dedicated meteorologist (and other involved key personnel) will consider weather information/forecasts from several (all available) sources. 3. Based on sensitivity with regards to weather conditions smaller intervals may be required. 4. Meteorologist shall be conferred if the weather situation is unstable and/or close to the defined limit. 5. The most severe weather forecast to be used. DNV-OS-H101- Marine Operations, General

How is the forecast generated?

SUT - Lunch & Learn at Charles Taylor & Co

slide-20
SLIDE 20

20 @Fugro GEOS Ltd www.fugro.com

Are all forecasts equal?

SUT - Lunch & Learn at Charles Taylor & Co

  • How is the forecast generated?
  • Which models support the forecast?
  • What other ‘guidance data’ supports the forecast?
  • Does the forecaster have regional experience?
  • Are observations available to the forecaster?
  • Are the synoptic difficult / easy to forecast?
slide-21
SLIDE 21

21 @Fugro GEOS Ltd www.fugro.com

Alpha Factors

α Design Hs = 2m Design Hs = 4m TPOP A B C A B C ≤12 0.76 0.80 0.95 0.83 0.87 1.00 ≤24 0.73 0.77 0.84 0.80 0.84 0.87 ≤36 0.71 0.75 0.77 0.77 0.80 0.80

WF WF WF WF Operation starts TR Required weather window with OPWF = α x OPLIM Estimated time for the operation TPOP (Basis for selecting α-factor) Contingency TC DNV-OS-H101- Marine Operations, General

SUT - Lunch & Learn at Charles Taylor & Co

slide-22
SLIDE 22

22 @Fugro GEOS Ltd www.fugro.com

Alpha Factors Reliability

  • No requirement for 2nd forecast to be forecaster driven, many companies use model driven forecasts

to reduce cost.

  • Potential for underlying models to be similar, e.g. public domain models such as WW3 or ECMWF.
  • No consideration of ensemble forecasting
  • Reliability of site specific forecasts not addressed.
  • No consideration of reliability of models and forecasting under different synoptic conditions.
  • No consideration of personnel competency

SUT - Lunch & Learn at Charles Taylor & Co

slide-23
SLIDE 23

23 @Fugro GEOS Ltd www.fugro.com

Forecast Reliability – Dichotomous Approach

Result Forecast Hit event forecast to occur, and did occur Miss event forecast not to occur, but did occur False Alarm event forecast to occur, but did not occur Correct negative event forecast not to occur, and did not occur Observed yes No Total Analysis yes hits false alarms forecast yes no misses correct negatives forecast no Total

  • bserved yes
  • bserved no

total

Requires investment in measurement and forecasting prior to construction. Potential to use exploration phase to build this.

SUT - Lunch & Learn at Charles Taylor & Co

slide-24
SLIDE 24

24 @Fugro GEOS Ltd www.fugro.com

Forecast Reliability – Dichotomous Approach

NAME EQUATION Accuracy (fraction correct) Bias score (frequency bias) Probability of detection (hit rate) False alarm ratio

Requires investment in measurement and forecasting prior to construction. Potential to use exploration phase to build this.

SUT - Lunch & Learn at Charles Taylor & Co

slide-25
SLIDE 25

25 @Fugro GEOS Ltd www.fugro.com

Measurements - Site specific

Measurements provide:

  • Confidence in forecast model (does T+0 match reality)
  • Potential to reduce DNV α factor
  • Confidence in data during operation and for contractual purposes post execution.
  • Potential to offer early warning systems

SUT - Lunch & Learn at Charles Taylor & Co

slide-26
SLIDE 26

26 @Fugro GEOS Ltd www.fugro.com

Measurements - Site specific

Measurements provide:

  • Confidence in forecast model (does T+0 match reality)
  • Potential to reduce DNV α factor
  • Confidence in data during operation and for contractual purposes post execution.
  • Potential to offer early warning systems

Soliton generation zone Andaman Sea

Malacca Strait

Sumatra 2 x Real-time SEWS moorings SEWS#1 SEWS#2

SUT - Lunch & Learn at Charles Taylor & Co

slide-27
SLIDE 27

27 @Fugro GEOS Ltd www.fugro.com

Measurements - Spatial

Measurements can provide a spatial picture.

  • Marine Autonomous Systems offer a low cost way to collect spatial measurements
  • Airborne current measurement systems
  • Satellite measurement technology – GNSS reflectometry

SUT - Lunch & Learn at Charles Taylor & Co

slide-28
SLIDE 28

28 @Fugro GEOS Ltd www.fugro.com

Response Modelling

Joe Bloggs

SUT - Lunch & Learn at Charles Taylor & Co

slide-29
SLIDE 29

29 @Fugro GEOS Ltd www.fugro.com

Structural Monitoring

Measuring Environmental Forces provides on half of the equation. The other half is the motion response and structural response Consideration should also be given to measuring structural responses during construction. Examples include:

  • Motion sensors
  • Not a single sensor but at critical

locations, e.g. crane tip, launch points, etc

  • Strain measurements

Likely driven by critical components/operations.

SUT - Lunch & Learn at Charles Taylor & Co

slide-30
SLIDE 30

30 @Fugro GEOS Ltd www.fugro.com

Metocean Awareness

The data consumer! Convert data into decisions!

SUT - Lunch & Learn at Charles Taylor & Co

slide-31
SLIDE 31

31 @Fugro GEOS Ltd www.fugro.com

Metocean Awareness

Parameter (s) Operating limit Status Hs Tp Ws Cs WL

The data consumer! Convert data into decisions!

SUT - Lunch & Learn at Charles Taylor & Co

slide-32
SLIDE 32

32 @Fugro GEOS Ltd www.fugro.com

Execution Summary

Understand forecast provenance / reliability. Complement forecasts with measurements to reduce risk. Consider use of spatial measurement techniques to identify frontal features. Consider use of remote measurements to provide early warning.. Help to drive new technology adoption – operators/contractors often very conservative. Move to decision making systems rather than Metocean data systems. Incentivise risk management!

SUT - Lunch & Learn at Charles Taylor & Co

slide-33
SLIDE 33

33 @Fugro GEOS Ltd www.fugro.com

Analysis

Plan Execution Forecast performance Operational Performance Lessons Learned Contractors

SUT - Lunch & Learn at Charles Taylor & Co

slide-34
SLIDE 34

Thank you. Questions?

Mark Calverley M.calverley@fugro.com 01491 820546