SLIDE 1
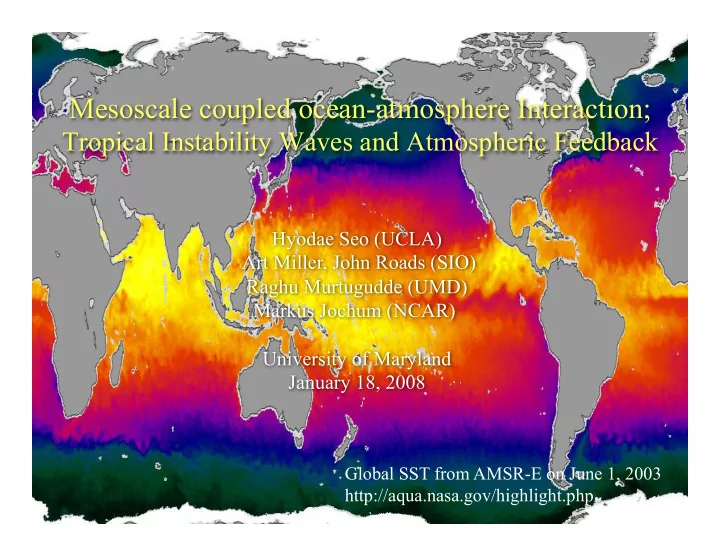
Mesoscale coupled ocean-atmosphere Interaction;
Tropical Instability Waves and Atmospheric Feedback
Hyodae Seo (UCLA) Art Miller, John Roads (SIO) Raghu Murtugudde (UMD) Markus Jochum (NCAR) University of Maryland January 18, 2008
Global SST from AMSR-E on June 1, 2003 http://aqua.nasa.gov/highlight.php
SLIDE 2
Global SST from AMSR-E on June 1, 2003 http://aqua.nasa.gov/highlight.php
SLIDE 3 Relation of SST and wind speed on basin, seasonal scale
Atmospheric wind variability drives oceanic SST response through altered turbulent heat flux and possibly mixing
Ocean) Matuna et al. 1999
SLIDE 4 How about on oceanic mesoscale? (highpass filtering)
- Correlation of SST (TMI) and wind speed (QuikSCAT) on
short/small scales
- Positive correlation (Ocean Atmosphere)
- Negative correlation (Atmosphere Ocean)
Xie et al. 2004
SLIDE 5 Scripps Coupled Ocean-Atmosphere Regional (SCOAR) Model
IC and Lateral BC: NCEP Reanalysis
OCEAN ATMOS
Flux-SST Coupler
ECPC Regional Spectral Model (RSM)
Lateral BC: Ocean analysis/climatology
Regional Ocean Modeling System (ROMS)
SST Current Flux
Purpose: Examine air-sea coupled feedback arising in the presence of oceanic and atmospheric mesoscale features
1) Higher model resolution 2) Dynamical consistency with the NCEP Reanalysis forcing 3) More complete and flexible coupling strategy 4) Parallel architecture 5) State-of-the-art physics 6) Greater portability
SLIDE 6 Scripps Coupled Ocean-Atmosphere Regional (SCOAR) Model Seo et al. GRL (2006): Effect
- f ocean mesoscale variability
- n the tropical Atlantic climate
SST
Seo et al. JCLI (in press): African Easterly Waves and ITCZ precipitation Seo et al. JCLI (2007b): Atmospheric feedback to TIWs
R(u’,τ’)
Seo et al. JCLI (2007a): coupled processes in eastern Pacific sector
AEW CCS Gap winds TIWs
SLIDE 7
Mesoscale ocean-atmosphere interaction: tropical instability waves and atmospheric feedback
Correlation of uʹ″ ʹ″sfc and τʹ″ τʹ″ τʹ″ τʹ″ and TIWs LHʹ″ ʹ″ on SST of TIWs.
SLIDE 8 Tropical Instability Waves (TIWs);
Wentz et al. 2000; 45 km ROMS + 50 km RSM, daily coupled
MODEL: Eastern Pacific TIWs OBS: TRMM Microwave Imager SST
- Instability of equatorial currents and front
- Strong mesoscale ocean-atmosphere interactions
SLIDE 9
Feedback from wind response?
SST Wind 1) Direct influence from SST (Wallace et al. 1989; Lindzen and Nigam 1987) 2) Modification of wind stress curl (Chelton et al. 2001) An idealized study (Pezzi et al. 2004): wind-SST coupling (that includes both effects) slightly reduces variability of TIWs. But.. why?
Combined EOF 1 of SST and Wind vectors
SLIDE 10
Covariability (correlation) of uʹ″sfc and τʹ″
SLIDE 11 Covariability of uʹ″sfc and τʹ″
Daily coupled 6-year simulations (1999-2004) 1/4° ROMS + 1/4° RSM Effect of correlation
ʹ″sfc and τʹ″ τʹ″ on the EKE of the waves
U ⋅ ∇ K
e + ʹ″
u ⋅ ∇ K
e = −
∇ ⋅ ( ʹ″ u ʹ″ p ) − g ʹ″ ρ ʹ″ w + ρo(− ʹ″ u ⋅ ( ʹ″ u ⋅ ∇ U )) +ρoAh ʹ″ u ⋅ ∇2 ʹ″ u + ρo ʹ″ u ⋅ (Av ʹ″ u
z)z
Masina et al. 1999; Jochum et al. 2004;
EKE Equation
+ ʹ″ u
sfc ⋅
ʹ″ τ
z
SLIDE 12 Correlation of TIW-current and wind response
- Wind and current are negatively correlated.
Correlation of vʹ″ ʹ″sfc and τʹ″ τʹ″y
τ y
ʹ″ τ
y
ʹ″ v ʹ″ v
ʹ″ τ
y
EQ
Correlation of uʹ″ ʹ″sfc and τʹ″ τʹ″x
τ x
ʹ″ τ
x
ʹ″ τ
x
ʹ″ u ʹ″ u ʹ″ u ʹ″ u
- Wind-current coupling Energy sink
EQ
SLIDE 13 EKE from the correlation of uʹ″sfc and τʹ″
TIWs is ~10% of barotropic convergent rate.
sink of energy
previous study.
U ⋅ ∇ K
e + ʹ″
u ⋅ ∇ K
e = −
∇ ⋅ ( ʹ″ u ʹ″ p ) − g ʹ″ ρ ʹ″ w + ρo(− ʹ″ u ⋅ ( ʹ″ u ⋅ ∇ U )) +ρoAh ʹ″ u ⋅ ∇2 ʹ″ u + ρo ʹ″ u ⋅ (Av ʹ″ u
z)z + ʹ″
u
sfc ⋅
ʹ″ τ
z
Averages: 30W-10W, 1999-2004, 0-150 m depth barotropic conversion rate
Wind energy input
[10-6kg/ms3]
1 d ( ʹ″ u
sfc • ʹ″
τ
z)dz d sfc
∫
1 d (−ρ ʹ″ u ʹ″ v Uy)dz
d sfc
∫
SLIDE 14
How about the TIWs in the Pacific Ocean?
IROAM results (from J. Small)
IPRC Regional coupled model (IROAM) results are consistent with SCOAR results. Wind inputs are 10 times stronger in the Pacific.
barotropic wind [10-5kg/ms3]
SLIDE 15
Perturbation wind stress curl and TIWs
SLIDE 16 Coupling of SST gradient and wind stress derivatives
TRMM & QuikSCAT from D. Chelton
θ τ ∆Τ
DIV CURL
∇T × τ
^
^
= ∇T sinθ
WSC is linearly related to Crosswind SST gradient WSD is linearly related to Downwind SST gradient ∇T •τ
^
= ∇T cosθ
Chelton et al. 2005
SLIDE 17
Coupling of SST gradient and wind stress derivatives
Model OBS: Chelton et al. 2005
SLIDE 18
Coupling strength (coefficient)
WSD and DdT WSC and CdT Observed: 1.35 Observed: 0.75
Chelton et al. 2001
Model: 1.47 Model: 0.89 5S-5N, 125-100W, July- December, 1999-2003 The SCOAR model well
reproduced the observed linear relationship in the eastern tropical Pacific TIW case.
SLIDE 19
So, does this perturbation wind stress curl feed back on to TIWs?
Spall (2007): Impact of the observed coupling on the baroclinc instability of the ocean Perturbation Ekman pumping reduces the growth rate of the most unstable wave. Condition: Southerly wind from cold to warm.
COLD WARM
SLIDE 20
Feedback of perturbation Ekman pumping to TIWs
Unit: 10-6m/s, Zonally highpass filtered, and averaged over 30W-10W
w´ at MLD and ωe´ along 2°N
Perturbation Ekman pumping velocity (ωe´) and perturbation vertical velocity (w´) of -gρ´w´. Overall, ωe´ is much weaker than w´. Caveat: Difficult to estimate Ekman pumping near the equator, where wind stress curl is large.
SLIDE 21
- SST-induced summertime Ekman upwelling velocity is as
large as its mean. Feedback is important to ocean circulation and the SST.
What about in the mid-latitudes, as in the CCS region?
(Chelton et al. 2007) SCOAR Model
anomaly mean anomaly mean
SLIDE 22 Response and feedback
SLIDE 23 Observations of radiative and turbulent flux
Zhang and McPhaden (1995): ~50 W/m2 per 1K of latent heat flux. Thum et al. (2002) found a similar value and a simple heat balance results in -0.5°C / month (MLD=50m). Deser et al. (1993): changes in solar radiation of ~10 W/m2 due to 1K changes in SST -0.75°C / month (MLD=20m).
- Instantaneous damping of local SST by perturbation heat flux
Deser et al. 1993
Solar heat flux and SST Latent heat flux and SST
Liu et al. 2000
SLIDE 24 Coupling of SST and latent heat flux in SCOAR
Tropical Atlantic Eastern Tropical Pacific
- Model results also suggest a
damping by turbulent heat flux on the local SSTs.
SLIDE 25 Large-scale rectification from heat flux anomalies??
- Rectification by high-frequency
(TIW-induced) LHʹ″ is small compared to mean LH.
- TIWs still operate over the large-
scale SST gradient to modulate the temperature advection (Jochum and Murtugudde 2006, 2007). Reynolds averaging of LH Latent Heat Flux Parameterizations
6-year time series at 2°N averaged over 30°W-10°W
Perturbation: Mean: UΔq
ʹ″ U Δ ʹ″ q
SLIDE 26
Summary; TIW-atmosphere coupling
TIWs SST´ τ´ heat flux´ U´sfc ∇× ∇× τ´
Negligible contribution at 2N (difficult to estimate near the equator) small Damping of local SST (but small rectification to large-scale SST) local
damping
±15-25% modification TIW-currents alter surface stress by ±15-25% depending on phase damping Wind response damps TIW-current: Small but significant damping
SLIDE 27 Conclusion and outlook
Using this SCOAR model, we have studied 1) mesoscale air-sea coupled feedbacks in the eastern Pacific sector, and 2) connection with the large-scale climate variability in the tropical Atlantic sector. We continue to examine various aspects of coupled variability
- n many spatial and temporal scales occurring throughout the
global ocean.
SLIDE 28 Some current works
Indian Ocean: Regional coupled processes in the western Arabian Sea, Bay of Bengal, and Southern IO. Their connection with the monsoonal and basin-scale variability. North Pacific: Effect of eddies and the
- cean atmosphere coupling on the KE
variability and the downstream effect DJF JJA June-August climatology
SLIDE 29
Thanks!
SLIDE 30 Impact of ocean current
- n the surface stress estimate
Kelly et al. (2001): wind difference measured from QuikSCAT
and TAO array resembles mean equatorial surface currents.
SLIDE 31 Effect of ocean current on the surface stress estimate
time mean
Ocean currents (mean + TIWs) reduce surface stresses by 15-20% (Pacanowski 1987; Luo et al. 2005; Dawe and Thompson 2006).
τ
1 = ρCd (
u
a −
u
τ
2 = ρCd (
u
a)2
|τ1|-|τ2|; effect of ocean currents (mean + TIW) on the surface wind stress
τ
1 −
τ
2
τ
1
SLIDE 32 Effect of perturbation current on the surface stress estimate
TIW currents can modulate the surface stress estimate by ±15-25%. Consistency problem in a forced model with the QuikSCAT winds?
τ
3 = ρCd (
u
a −
u
τ
1 = ρCd (
u
a −
u
τ
1 −
τ
3
τ
1
|τ1|-|τ3| at 2°N, 20°W-15°W
|τ1|-|τ3|; effect of perturbation
- cean current velocity on wind stress
Correlation with TIW currents : -0.83
SLIDE 33
Modulation of SST and wind stress by TIWs
3-day averaged SST and wind stress centered on Sep. 3, 1999 Stronger wind stress over the regions of warm water