Thermal environment in Hong Kong Source: USEPA - - PowerPoint PPT Presentation

thermal environment in hong kong
SMART_READER_LITE
LIVE PREVIEW

Thermal environment in Hong Kong Source: USEPA - - PowerPoint PPT Presentation

Effect of revitalizing water Steve H.L. YIM 1,2,3 bodies on thermal environment 1 Department of Geography and Resource Management, CUHK 2 Institute of Environment, Energy and Sustainability (IEES), CUHK DSD R&D Forum 2017 3 Centre for


slide-1
SLIDE 1

香港中文大學 The Chinese University of Hong Kong

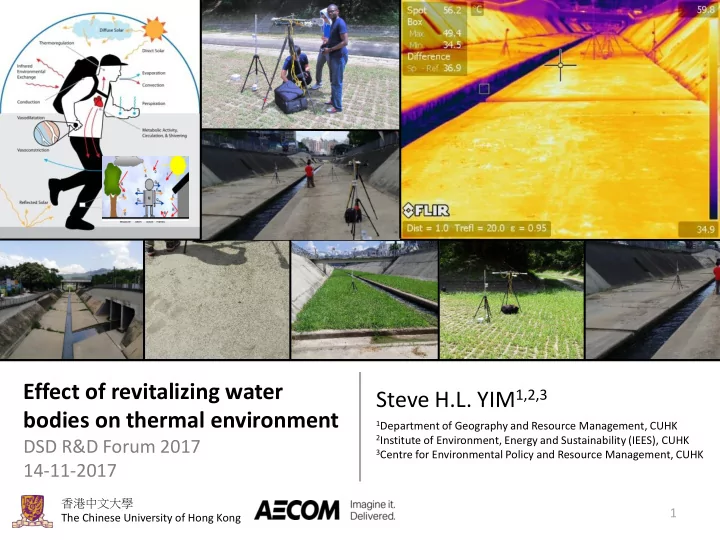
Effect of revitalizing water bodies on thermal environment

DSD R&D Forum 2017 14-11-2017

Steve H.L. YIM1,2,3

1Department of Geography and Resource Management, CUHK 2Institute of Environment, Energy and Sustainability (IEES), CUHK 3Centre for Environmental Policy and Resource Management, CUHK

1

slide-2
SLIDE 2

Thermal environment in Hong Kong

Source: USEPA (http://www.epa.gov/hiri/resourc es/pdf/BasicsCompendium.pdf)

2 4 6

Monthly mean number of Very Hot days observed at the Hong Kong Observatory (1981-2016)

Daily maximum temperature ≥ 33.0°C

2

slide-3
SLIDE 3

Introduction

  • This assessment is under the consultancy of

Feasibility on Revitalisation of Water Bodies to assess the potential benefits provided by revitalised water bodies.

3

slide-4
SLIDE 4

Objectives

  • To evaluate the effect of various land covers
  • n urban heat island effect and thermal

comfort in Hong Kong context

  • To compare and rank the performance among

studied land covers

  • To provide recommendations to river

revitalization

4

slide-5
SLIDE 5

Studied rivers

5

Lam Tsuen River Yuen Long Nullah

slide-6
SLIDE 6

6

Measurements

  • 1. Surface temperature
  • 2. Ambient temperature

and relative humidity

FLIR SC660 HOBO temperature/RH

  • 3. Short- and long-wave

radiations (mean radiant temperature for thermal comfort)

4. Wind speed and direction

CNR4 Net Radiometer Davis Anemometer

slide-7
SLIDE 7

7

UHI and thermal comfort

Semi Grass Concrete Full Grass Dry Clay Water Thermal comfort Surface urban heat island Atmospheric urban heat island Reference

slide-8
SLIDE 8

Land Cover Types

8

Different land covers (4 types) Yuen Long Nullah

1 2 1 3 4 A B C

Concrete Semi-Grass Full-Grass Dry Clay Pedestrian Level 1: Concrete 3: Semi Grass 4: Full Grass 2: Dry Clay

Time Period Duration Locations of Measurements 1 15 min A, B, C, 1, 3 2 15 min A, B, C, 2, 4 3 15 min A, B, C, 5, C2 (under tree)

slide-9
SLIDE 9

Land Cover Types

9

Different land covers (4 types) Lam Tsuen River A B 1 3 2 4 5 C Pedestrian Level Concrete Water Semi-Grass small-Grass Full-Grass A: Wind Speed and Direction 1: Concrete 2: small Grass 3: Semi-Grass 4: Full Grass Limitation 5: water

Time Period Duration Locations of Measurements 1 15 min A, B, C, 1, 3 2 15 min A, B, C, 2, 4

slide-10
SLIDE 10

Measurement schedule

No. Date Time Start End 1 June 20* 11:45 21:30 2 June 21* 11:45 21:30 3 June 22 11:45 21:30 4 June 23 11:30 21:30 5 July 8^ 11:30 21:30 6 July 18 14:00 21:30 7 July 23 11:45 21:30 8 July 25 12:00 21:45 9 August 23 12:00 21:45 10 August 24 12:00 21:45

10 Cloud \ Tair, 1.2m III: (33oC ≤ Tair, 1.2m < 34oC ) IV: (34oC ≤ Tair, 1.2m < 35oC) CR: Clear Sky 23/6, 23/8 25/7, 24/8 NC: Non-Clear Sky 22/6, 18/7 23/7 Cloud \ Tair, 1.2m III: (33oC ≤ Tair, 1.2m < 34oC) IV: (34oC ≤ Tair, 1.2m < 35oC) CR: Clear Sky 24/8 22/6, 23/7, 25/7 NC: Non-Clear Sky 23/6, 18/7 23/8 Yuen long Nullah Lam Tsuen River

slide-11
SLIDE 11

Major variables for analyses

  • Surface temperature
  • Long-wave radiation flux
  • Long-wave mean radiant temperature

11

slide-12
SLIDE 12

12

What is Mean Radiant Temperature, MRT?

Integral Radiation measurements

𝑇𝑡𝑢𝑠 = 𝛽𝑙 ෍

𝑗=1 6

𝐿𝑗𝐺𝑗 + 𝜁𝑞 ෍

𝑗=1 6

𝑀𝑗𝐺𝑗

Sofia Thorsson et al, 2007

Solar and Infrared Radiation Measurements Frank Vignola, Joseph Michalsky, and Thomas Stoffel CRC Press 2012

300 nm to 2800 nm short-wave 4.5 to 42 μm long-wave

𝑁𝑆𝑈 =

4 (

Τ 𝑇𝑡𝑢𝑠 𝜁𝑞𝜏) − 273.15

Weighted Sum of Short-wave Weighted Sum of Long-wave

slide-13
SLIDE 13

13

Hypothetical Study – Part 1

A2 A2 A3

𝑀𝑗 = ෍

𝑘

𝑀𝑘𝐺𝑗−𝑘

A4 A2 A2 A3 A4 N

% easterly: concrete + water + concrete L_easterly = 2(Fe_3) Lwat + 2(Fe_2 + Fe_4)Lcon + (1-2Fe_234)Lair; LMRT_easterly = (L_easterly /(0.97*sigma))^(0.25) - 273.15; x3: 0 – 100m; % independent variable % increasing x4 = 100 – x3; % in m r3: x3/100;

slide-14
SLIDE 14

14

Hypothetical Study – Part 1

A2 A2 A3 A4 A2 A2 A3 A4

% easterly: concrete + grass + concrete L_easterly = 2(Fe_3) Lgra + 2(Fe_2 + Fe_4)Lcon + (1-2Fe_234)Lair; LMRT_easterly = (L_easterly /(0.97*sigma))^(0.25) - 273.15; x3: 0 – 100m; % independent variable % increasing x4 = 100 – x3; % in m r3: x3/100;

𝑀𝑗 = ෍

𝑘

𝑀𝑘𝐺𝑗−𝑘

N

slide-15
SLIDE 15

15

Hypothetical Study – Part 1

X3 (m) Long-wave radiation :east (W/m2) concrete grass water X3 X4 X1 (5m) X2 (0.5m) 10m X3 (m) grass water concrete LMRT: east (°C) Don’t cite; Not yet published

slide-16
SLIDE 16

16

Hypothetical Study – Part 2

A2 A2 A3 A4 A2 A2 A3 A4

% easterly: concrete + water + concrete L_easterly = 2(Fe_4) Lwat + 2(Fe_2 + Fe_3)Lcon + (1-2Fe_234)Lair; LMRT_easterly = (L_easterly /(0.97*sigma))^(0.25) - 273.15; x3: 0 – 100m; % independent variable % increasing x4 = 100 – x3; % in m r3: x3/100;

𝑀𝑗 = ෍

𝑘

𝑀𝑘𝐺𝑗−𝑘

N

slide-17
SLIDE 17

17

Hypothetical Study – Part 2

A2 A2 A3 A4 A2 A2 A3 A4

% easterly: concrete + grass + concrete L_easterly = 2(Fe_4) Lgra + 2(Fe_2 + Fe_3)Lcon + (1-2Fe_234)Lair; LMRT_easterly = (L_easterly /(0.97*sigma))^(0.25) - 273.15; x3: 0 – 100m; % independent variable % increasing x4 = 100 – x3; % in m r3: x3/100;

𝑀𝑗 = ෍

𝑘

𝑀𝑘𝐺𝑗−𝑘

N

slide-18
SLIDE 18

18

Hypothetical Study – Part 2

X3 (m) Long-wave radiation :east (W/m2) concrete grass water X3 X4 X1 (5m) X2 (0.5m) 10m X3 (m) concrete LMRT: east (°C) grass water Don’t cite; Not yet published

slide-19
SLIDE 19

Conclusions

  • Concrete and dry clay land covers can cause

a 20-22°C increase in surface temperature and a 12-13°C increase in LMRT. The concrete and dry clay land covers should be avoided.

  • Water is effectively to reduce surface

temperature (↓7°C) and thermal discomfort (↓ 4°C LMRT).

  • Full Grass should be considered to improve

the thermal environment including both surface temperature (↓6°C) and thermal comfort (↓ 3°C LMRT).

19

Water Don’t cite; Not yet published

slide-20
SLIDE 20

Conclusions

20

  • The width of belt and the land cover
  • f banks should be carefully

designed to mitigate thermal discomfort.

  • The cooling effect of the width on

revitalisation of water bodies is up to ~30m.

  • The cooling effect of the width on

promenade is up to ~30m.

X3 X4 X1 (5m) X2 (0.5m) 10m X3 X4 X1 (5m) X2 (0.5m) 10m Don’t cite; Not yet published

slide-21
SLIDE 21

Conclusions

  • Effect of land covers on thermal

environment should be taken into account in water body designs and management.

  • Land cover effect information should

be integrated into relevant guidance and policy documents.

21

Don’t cite; Not yet published

slide-22
SLIDE 22

Limitations - General

  • Yuen Long Nullah is strongly affected by the surrounding

concrete bank and the narrower belt;

  • Lam Tsuen River has more diverse ambient environment,

different size of trees and unevenly distributed green features – such as the impact of tree shading effect on measurement

  • ver the measurement over concrete land cover type;
  • Results will be affected by a number of environmental factors,

especially in Lam Tsuen River;

22

slide-23
SLIDE 23

Limitations – Land covers

  • A real and fully sunlit bare concrete was missed for better reference

at Lam Tsuen River due to renovation of pavement.

  • Yuen Long Nullah, differences in long-wave radiant fluxes, might be

attributed to a larger distance between bare concrete land cover and other types of land covers;

  • At Yuen Long Nullah, the solar radiation incident on the bare

concrete might be blocked by nearest residential building in the early evening.

  • Length of leaves of any grass land covers (semi-grass, full grass, and

small grass) varied due to uncontrolled growth and unexpected mowing work;

23

slide-24
SLIDE 24

Limitations – Method

  • The weather conditions were not significantly different in

daytime for each site;

  • This study was performed for a limited number of time due to

the restriction of weather conditions and safety concerns.

  • Conducting field measurements at a limited number of sites

may not allow us to understand the situation in other environments.

24

slide-25
SLIDE 25

Acknowledgment

  • A group of CUHK helpers: Alan Lai, Samuel Tang, Yongli Wang,

Ifean Nduka, Marcu Tong, Sammi Luk, Matthew Ma, Gabriel Fan, Kenji Leong, Dennis Leung, Claire Tang, Calvin Chan, Edwin Yeung, Sabrina Hung, Aaran Lam, Andy Tang, Rebecca Liu, Jamie Wong, Henry Wong, Hung Sze Ping, Claudia Ng, Lee Wing Yung

  • Max Lee from the School of Architecture at CUHK
  • DSD and AECOM

25

slide-26
SLIDE 26

END

26