SLIDE 1
8/8/2011 1
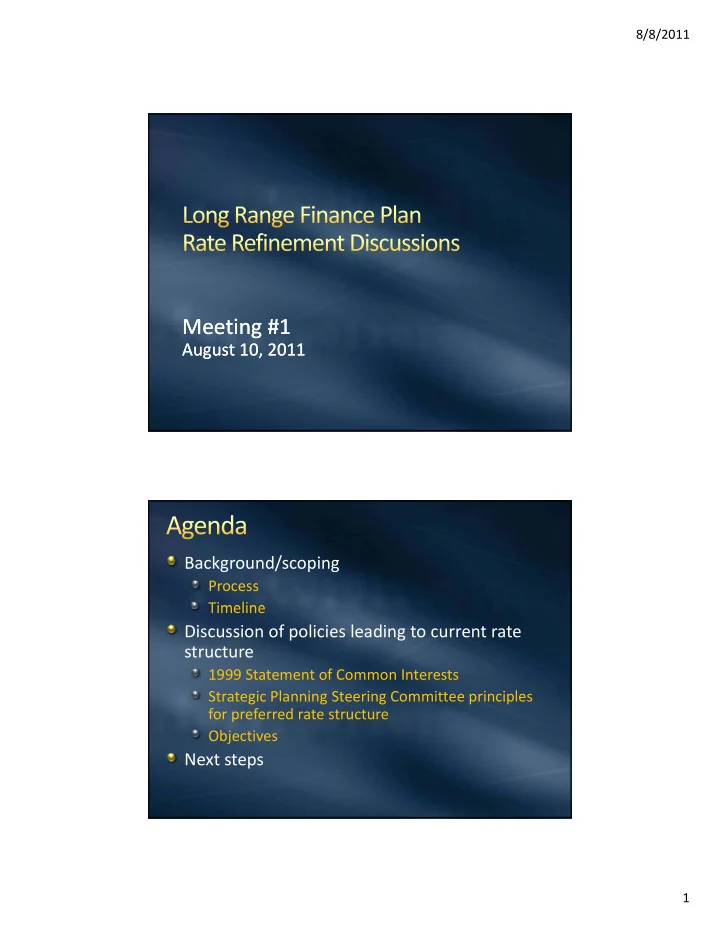
Meeting #1 Meeting #1 Meeting #1 Meeting #1
August 10, 2011 August 10, 2011 Background/scoping
Process Timeline Timeline
Discussion of policies leading to current rate structure
1999 Statement of Common Interests Strategic Planning Steering Committee principles for preferred rate structure for preferred rate structure Objectives
Next steps
SLIDE 2
8/8/2011 2
LRFP Rates Subgroup started mid‐2007 to discuss refinement of existing rate structure Topics covered: Topics covered:
Appropriate level of discount for Replenishment and IAWP Treated Water Peaking cost recovery Growth charge to recover infrastructure costs (Tier 2 addresses impact of Growth on supply costs) 2 addresses impact of Growth on supply costs) Tier 1 versus Tier 2 differential Cost of Service review
SLIDE 3
8/8/2011 3
Eliminate the IAWP Increase the Tier 1 versus Tier 2 differential Implement the Delta Supply Surcharge Board affirmed the Cost‐of‐Service approach Purchase Orders expire December 31, 2012 Path to move forward
Continue Purchase Orders? Adjustments to rate structure? Non‐binding notices of intention to renew were received from: Anaheim, Beverly Hills, Burbank, Calleguas, Central Basin, Eastern, Foothill, Fullerton, Glendale, Inland , , , , , Empire, Las Virgenes, Long Beach, Los Angeles, MWDOC, Santa Ana, Three Valleys, Torrance, Upper San Gabriel, West Basin and Western
SLIDE 4 8/8/2011 4
Level of commitment was set at 60% of the IBFD to allow for wet hydrology Growing agencies (Calleguas, Eastern, Western, Las Virgenes) had met their commitments by the end Virgenes) had met their commitments by the end
All but three agencies had met their commitments by the end of the eighth year Agencies not meeting their commitment only pay the Supply portion of the rates on undelivered water pp y p A condition of the phase out of the IAWP allowed participating member agencies to increase their Tier 1 limits for IAWP opt‐outs; total of Tier 1 limit for CY 2012 is 1.96 MAF
Relevant sections of the Administrative Code:
§ 4122 Base Firm Demand; Initial Base Firm § 4122. Base Firm Demand; Initial Base Firm Demand. § 4401. Rates. § 4404. Purchase Orders.
Without Purchase Orders, the Tier 1 limit drops to 60% of Base Firm Demand to 60% of Base Firm Demand
SLIDE 5 8/8/2011 5
1 96 2.5 1.96 1.26 1 1.5 2 MAF 1.8 MAF 0.5 Current Tier 1 60% of BFD
SLIDE 6
8/8/2011 6
Status Quo Rate Structure adjustments Rate Structure adjustments Change or eliminate Purchase Orders Fixed revenue generation Replenishment (Workgroup report in September) Growth charge for infrastructure Growth charge for infrastructure Tier 1 limit / trading Tier 1 limits Treated water cost recovery Aligning the WSAP and implementation of rates and charges Fixed commitment to pay for the system (contracts) Fixed commitment to pay for the system (contracts) Compton: Purchase Order commitment shortfall Additional items to be considered based on Member Agency feedback
SLIDE 7 8/8/2011 7
July 2011 Member Agency Managers meeting: open up discussions i k ff Kick off August 2011 August 2011 F&I: Oral Report Target completion for summer of 2012
2011 2012
A S O N D J F M A M J J A S O N D
Milestones
Aug Sep Oct Nov Dec Jan Feb Mar Apr May Jun Jul Aug Sep Oct Nov Dec
Board Updates 2013 Rates Long Range Finance Plan
SLIDE 8 8/8/2011 8
Regional Regional Provider Provider Regional Regional Provider Provider
MWD MWD MWD MWD
Provider Provider Provider Provider Financial Financial Integrity Integrity Financial Financial Integrity Integrity Local Local Resources Resources Local Local Resources Resources Responsibility Responsibility for Water for Water Responsibility Responsibility for Water for Water Cost Cost Allocation Allocation & Rate & Rate Structure Structure Cost Cost Allocation Allocation & Rate & Rate Structure Structure Resources Resources Development Development Resources Resources Development Development Imported Imported Water Water Service Service Imported Imported Water Water Service Service Choice & Choice & Competition Competition Choice & Choice & Competition Competition for Water for Water Quality Quality for Water for Water Quality Quality
SLIDE 9 8/8/2011 9 Regional Provider: In this capacity, MWD is the steward of regional infrastructure and the regional planner responsible for drought management and the coordination of supply and facility investments. Financial Integrity: The MWD Board will take all necessary steps to assure the financial integrity of the agency in all aspects of its
Local Resources Development: MWD supports local resources development in partnership with its member agencies and by providing its member agencies with financial incentives for conservation and local projects conservation and local projects. Imported Water Service: MWD is responsible for providing the region with imported water, meeting the committed demands of its member agencies.
Choice and Competition: Beyond committed demands, member agencies may choose the most cost‐effective additional supplies from MWD, local resource development, or market transfers. These additional supplies can be p , pp developed through a collaborative process to balance opportunities with affordability. Responsibility for Water Quality: MWD is responsible for advocating source water quality and implementing in‐basin water quality for imported supplies provided by MWD to assure full compliance with existing and future primary drinking water standards and to meet requirements for water recycling and groundwater replenishment. Cost Allocation and Rate Structure: The fair allocation of costs and financial Cost Allocation and Rate Structure: The fair allocation of costs and financial commitments for MWD’s investments in supplies and infrastructure will be addressed in a revised rate structure. Committed demand has yet to be
- determined. The revised rate structure will address allocation of costs,
financial commitment, unbundling of services, and fair compensation for services.
SLIDE 10 8/8/2011 10
Fair Fair Fair Fair
Rate Rate Structure Structure Rate Rate Structure Structure
Revenue Revenue Stability Stability Revenue Revenue Stability Stability No Customer No Customer No Customer No Customer Dry Year Dry Year Allocation Allocation Based on Based on Need Need Dry Year Dry Year Allocation Allocation Based on Based on Need Need No Customer No Customer Class Class Economically Economically Disadvantaged Disadvantaged No Customer No Customer Class Class Economically Economically Disadvantaged Disadvantaged Simple & Easy Simple & Easy to Understand to Understand Simple & Easy Simple & Easy to Understand to Understand Provide Provide Certainty & Certainty & Predictability Predictability Provide Provide Certainty & Certainty & Predictability Predictability
The rate structure should be fair. The rate structure should be based upon stability of The rate structure should be based upon stability of MWD’s revenue and coverage of its costs. The rate structure should provide certainty and predictability. The rate structure should not place a class of customers in a position of significant economic p g disadvantage. The rate structure should be reasonably simple and easy to understand. Any dry‐year allocation should be based upon need.
SLIDE 11 8/8/2011 11
1996 IRP : 3.1 MAF 2004 IRP Update: 2.6 MAF p 2010 IRP Update: 1.85 MAF
Calendar Year 2012 Tier 1 limit: 1.96 MAF
The principles and framework described above The principles and framework described above were developed after the 1996 IRP, which forecasted sales of 3.1 MAF by 2020. The 2010 IRP Update is projecting sales of 1.85 MAF in
- 2020. Given the lower sales forecast, are the
principles and framework goals above still principles and framework goals above still relevant? Are any listed above not relevant?
SLIDE 12 8/8/2011 12
The current rate structure is highly dependent g y p
- n volumetric sales revenue. Given
Metropolitan’s current and future business environment of selling less water compared to the 1996 IRP, does the current rate structure require changes?
80% 90% 100% Water S l 20% 30% 40% 50% 60% 70% Sales Other Charges 0% 10% 20% 1930 1937 1944 1951 1958 1965 1972 1979 1986 1993 2000 2007 Property Taxes
SLIDE 13 8/8/2011 13
What about the future of the Purchase Order? Th P h O d t bli h d b The Purchase Order established a member agency’s Tier 1 limit for purchasing full service
- water. The current aggregated total of member
agency Tier 1 limits in CY 2012 is 1.96 MAF. Is the current limit appropriate? Should all agencies be in Tier 2? What value is provided agencies be in Tier 2? What value is provided by a Tier 2 price if all sales are effectively in Tier 1? Given the objectives of Revenue Stability and j y Providing Certainty and Predictability, should the level of fixed charges and/or commitments increase? If so, what level of fixed charges and/or commitments are appropriate?
SLIDE 14 8/8/2011 14
90% 100% 20% 30% 40% 50% 60% 70% 80%
Other revenue % Volumetric revenue %
0% 10% YCWA SFPUC Tacoma MWD SAWS EBMUD SCWA SNWA SDCWA SCVWD Zone 7 CLWA AVEK CAWCD MWDOC Tampa Solano KCWA MWRA
Fixed revenue %
Standby Charge
Fixed charge per parcel or acre assessed on Fixed charge per parcel or acre, assessed on property taxes, used to offset the RTS
Property tax assessment
Provides revenues for General District expenses
Retail Meter Charge
$/meter assessed on all retail meters within the $/meter assessed on all retail meters within the service area
Monthly Water Service Charge
$/cfs based on meter capacity
SLIDE 15
8/8/2011 15
Feedback from today’s meeting
Help determine future discussions
Refine or reaffirm principles Begin discussions on specific issues