
SLIDE 1
Measuring CO, CH4, CO2 & H2O in A Single Instrument; Using New CRDS Technology to Characterize Urban Plumes & the Well-Mixed Atmosphere
Gloria Jacobson, Eric Crosson, Chris Rella, Picarro Inc., 3105 Patrick Henry Drive, Santa Clara California 95054 USA
http://www.esrl.noaa.gov/gmd/ccgg/flask.html
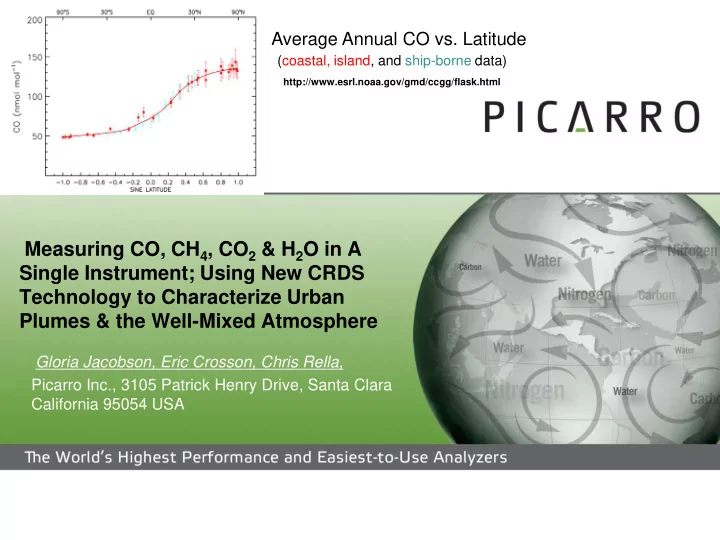
Average Annual CO vs. Latitude
(coastal, island, and ship-borne data)