Measurements of bromine oxide, iodine oxide and oxygenated - - PowerPoint PPT Presentation

measurements of bromine oxide iodine oxide and oxygenated
SMART_READER_LITE
LIVE PREVIEW

Measurements of bromine oxide, iodine oxide and oxygenated - - PowerPoint PPT Presentation

Measurements of bromine oxide, iodine oxide and oxygenated hydrocarbons in the tropical free troposphere from research aircraft and mountaintops Rainer Volkamer, Sunil Baidar, Sean Coburn, Barbara Dix, Ted Koenig, Siyuan Wang, MLO (since Jan


slide-1
SLIDE 1

Measurements of bromine oxide, iodine oxide and

  • xygenated hydrocarbons in the tropical free

troposphere from research aircraft and mountaintops

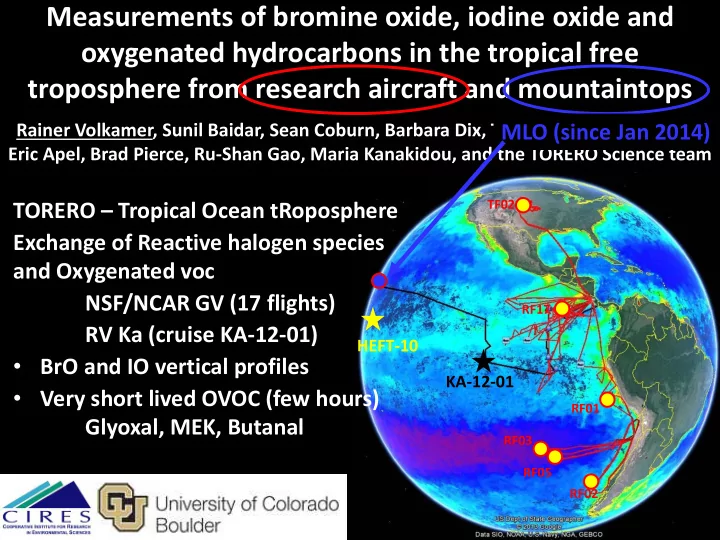
TORERO – Tropical Ocean tRoposphere Exchange of Reactive halogen species and Oxygenated voc NSF/NCAR GV (17 flights) RV Ka (cruise KA-12-01)

  • BrO and IO vertical profiles
  • Very short lived OVOC (few hours)

Glyoxal, MEK, Butanal

HEFT-10 KA-12-01

Rainer Volkamer, Sunil Baidar, Sean Coburn, Barbara Dix, Ted Koenig, Siyuan Wang, Eric Apel, Brad Pierce, Ru-Shan Gao, Maria Kanakidou, and the TORERO Science team

RF02 RF01 RF03 RF05 RF17 TF02

MLO (since Jan 2014)

slide-2
SLIDE 2

Halogens destroy tropospheric ozone, and thus OH How relevant is halogen chemistry?

O3

O2

O3 OH HO2,RO2

hν, H2O Deposition

O3

H2O2 ROOH

CO, VOC

O2

STRATOSPHERE TROPOSPHERE SURFACE

hn

biosphere combustion industry

X + O3 XO

hν, NO, HOX, aerosols, etc.

IO+HO2 → → OH BrO+HO2 → → OH

slide-3
SLIDE 3

Latitude [°]

30 60

  • 60
  • 30

monthly methane oxidation (GEOS-Chem)

4.0 8.0 12.0

108 kg CH4 month-1

Annual Average January July

Oxidation of long-lived gases by OH is mostly in tropics

Kevin Wecht, Harvard

TORERO Jan/Feb 2012 Latitude range

RF02 RF01 RF05

slide-4
SLIDE 4

BrO comparison: GOME-2 with GEOS-Chem, p-TOMCAT

Parrella et al. [2012] Theys et al. [2011] Halogens deplete the O3 column by ~10% in the tropics (Saiz-Lopez et al., 2012) ~0.2-0.5 ppt BrO, and <0.1 ppt IO

Satellite: 1-3 x10¹³ molec cm-2

(Chance et al., 1998; Wagner et al., 2001; Richter et al., 2002; Van Roozendael et al., 2002; Theys et al., 2011)

Ground : 1-3 x10¹³ molec cm-2

(Hendrick et al., 2007; Theys et al., 2007; Coburn et al., 2011; Coburn et al., 2014, in prep.)

Balloon: 0.2-0.3 x10¹³ molec cm-2

(Pundt et al., 2002; Schofield et al., 2004, 2006; Dorf et al., 2008)

Models: 0.2-1.0 x10¹³ molec cm-2

(Saiz Lopez et al., 2012; Parrella et al., 2012) – in the tropics

slide-5
SLIDE 5

* 30 sec, ** 60 sec integration time

Passive remote sensing column observations Trace gases and aerosols

CU-AMAX-DOAS instrument aboard NSF/NCAR GV

University of Colorado Airborne Multi-AXis Differential Optical Absorption Spectroscopy

Sun elevation angle height

concentration

solar zenith angle

Volkamer et al., 2009 spectrographs/detectors Volkamer et al., SPIE 2009 Baidar et al., AMT 2013 Telescope pylon motion stabilized

Sinreich et al., 2010, ACP Coburn et al., 2011, AMT Baidar et al., 2013, AMT Dix et al., 2013, PNAS Oetjen et al., 2013, JGR

slide-6
SLIDE 6

VOCs: NMHCs (C3-C10), OVOCs (C2-C9), HVOCs High selectivity GC/MS 2 minute continuous analyses of 50 VOCs Semi-autonomous operation up to 50,000 ft TORERO, DC3

Trace Organic Gas Analyzer (TOGA)

Gulfstream G-V

Eric Apel Alan Hills Becky Hornbrook Dan Riemer (U Miami) TORERO – Maiden Science Mission TOGA on GV aircraft Instrument designed to have very low limits of detection (low – sub pptv)

CU AMAX - DOAS

Volkamer group

* 30 sec; ** 60 sec integration time

slide-7
SLIDE 7

BrO and IO detection SH tropical troposphere

  • NH/SH tropics:

(1.5 ± 0.3) x1013 molec cm-2

  • SH sub-tropics:

(1.7 ± 0.3) x1013 molec cm-2

  • SH mid-latitudes:

(1.0 ± 0.3) x1013 molec cm-2

slide-8
SLIDE 8

Vertical profiles & comparison with models

  • GEOS-Chem: underestimates BrO by a factor 2-4
  • Box-model (organohalogens, aerosol SA) -> even less BrO

MLO ~3.6km

slide-9
SLIDE 9

Interim Conclusions

  • Ours are the first limb-observations of BrO and IO

in the tropics

  • BrO is detected regularly above 2-4 km; BrO and

IO are abundant throughout the air column

– Consistent with the GOME-2 satellite, ground-based MAX-DOAS data (Theys et al., 2011) – ~8 times higher than direct-sun profiles (Dorf et al.) – ~2-4 times more than predicted by models

  • Measurements support ~10-15 pptv Bry in the

tropical UTLS (~5-6 pptv Bry unaccounted ?)

slide-10
SLIDE 10

Mauna Loa Observatory, Hawaii CU-MAX-DOAS

Spectrometers

Parameters Detection Limit Figures of Merit BrO IO HCHO CHOCHO NO2 Extinction (360, 477, and 560nm) 0.3 ppt 0.05 ppt 100 ppt 3 ppt 10 ppt 0.01-0.03 km-1

  • 60s integration time
  • Full scan: 27 min
  • Footprint: 20-80km depending
  • n aerosol load and wavelength
  • Vertical profiles: ~3DoF

MAX-DOAS (~30min time resolution)

  • Vertical profiles of BrO and IO
  • Vertical profiles of OVOC
  • Stratospheric BrO

Zenith Sky mode (~85 SZA)

  • Stratospheric NO2, BrO
slide-11
SLIDE 11

Widespread BrO, IO, glyoxal, and NO2 in the FT

  • Oligotrophic ocean: ~ 15 pptv (10-20 pptv)
  • Mesotropic ocean: ~ 28 pptv (20-35 pptv)
  • FT: 5-15 ppt (Eastern) and 3-10 ppt (Central Pacific – HEFT-10)
  • Stratosphere: < 3 pptv – no signal is detectable
  • Glyoxal is widespread, possibly ubiquitous  a biogeochemical cycle

HEFT-10 RF02 RF01 RF03 RF05 RF17

Ocean biology signature ?

Chl-a < 0.02 mg/m3 Chl-a ~ 0.2-0.5 mg/m3

MLO

slide-12
SLIDE 12

Aerosols OVOC profiles Lifetime

slide-13
SLIDE 13

Conclusions

  • The TORERO mission was very successful – strong focus on

technological innovation

– first limb-observations of BrO and IO in the tropics – ~10-15 pptv Bry in the tropical UTLS – What is the Bry content in the lower stratosphere, and how much stratospheric Bry reaches the UTLS?

  • OVOC are widespread over oceans in the FT

– Detected by multiple techniques (DOAS, GC-MS) – Unaccounted ocean source of marine organic carbon (can NOT be explained from isoprene, monoterpenes) – Most of the OVOC column resides in the FT – implications for aerosols, oxidative capacity?

Funding: NSF-CAREER award, NSF-AGS (TORERO) Acknowledgements: NCAR/EOL and RAF, TORERO team

slide-14
SLIDE 14

14

Glyoxal in particles: Field evidence

Arctic aerosol: Alert

Peak in early spring Few weeks earlier than diacids 3-4 times more GLY than MGLY

Alert: Kawamura et al., 1996 Mexico City: Volkamer et al., 2007 Continental (Tibet): Meng et al., 2013 Marine: Matsunaga and Kawamura, 2004 Biogenic (Hyytiälä): Kampf et al., 2012 Southern Hemisph.: Rinaldi et al., 2011

GLYg = 42 ng /m3 (18 ppt) P / (P + G) = 0.46

Marine aerosol: Hokkaido Island

Lerot et al., 2010

Glyoxal is a ubiquitous product of anthropogenic and biogenic/marine precursors, and found in aerosols