Mark Hulbert ways of responding to lesson #1 BREAK/INTERMISSION - - PowerPoint PPT Presentation

mark hulbert
SMART_READER_LITE
LIVE PREVIEW

Mark Hulbert ways of responding to lesson #1 BREAK/INTERMISSION - - PowerPoint PPT Presentation

2017-04-15 Lessons learned from four Outline of my presentation decades of tracking advisers Overall lesson #1: It is extremely returns difficult to beat the market Overall lesson #2: There are rational Mark Hulbert ways of


slide-1
SLIDE 1

2017-04-15 1

Lessons learned from four decades of tracking advisers’ returns

Mark Hulbert

  • Founder, Hulbert Financial Digest
  • Senior columnist for Dow Jones (MarketWatch,

Wall Street Journal, Barron’s)

  • Columnist for USA Today, TheStreet.com

1

Outline of my presentation

Overall lesson #1: It is extremely

difficult to beat the market

Overall lesson #2: There are rational

ways of responding to lesson #1 BREAK/INTERMISSION

The do’s and don’ts of being a

contrarian

2

What I’ve been doing for the last 40 years

Since 1980 I have objectively tracked the performance of hundreds of investment advisers

  • I have done this by constructing model portfolios according

to the advice provided by those advisers

  • Trades are executed at the prices anonymous subscribers

would be able to act on the advice

  • Commissions (discount brokerage), dividends, splits, and

so forth are taken into account

The number of advisers who’ve beaten an index fund is so low that as a practical matter you could conclude that it’s not worth the effort to even try

3

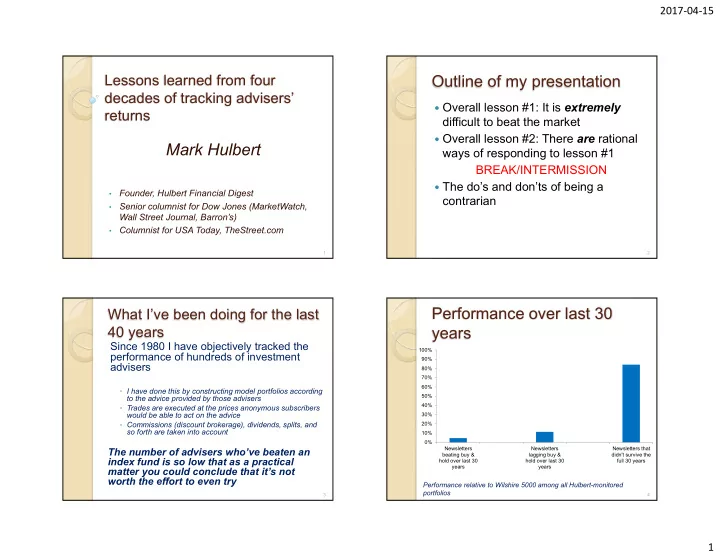
Performance over last 30 years

0% 10% 20% 30% 40% 50% 60% 70% 80% 90% 100% Newsletters beating buy & hold over last 30 years Newsletters lagging buy & hold over last 30 years Newsletters that didn't survive the full 30 years

Performance relative to Wilshire 5000 among all Hulbert-monitored portfolios

4

slide-2
SLIDE 2

2017-04-15 2

How did mutual funds fare?

According to Lipper, the VFINX has

  • utperformed 67% of all U.S. domestic equity

mutual funds over the last 30 years. This is very similar to my results for investment newsletters, due to survivorship bias

  • Lipper doesn’t have survivorship data over entire

30-year period.

  • But, according to Standard & Poor’s over the last

5 years, the following percentage of funds didn’t survive even 5 years:

  • 38.3% of large-cap funds
  • 39.1% of mid-cap funds
  • 45.5% of small-cap funds

5

Lessons learned

If you were to have picked an adviser

at random 30 years ago, you would have had a one-in-twenty chance of bettering the return of a simple index fund

Corollary: The average thing you do is

a mistake

6

Consider…

  • 4.00%
  • 3.50%
  • 3.00%
  • 2.50%
  • 2.00%
  • 1.50%
  • 1.00%
  • 0.50%

0.00% 4 months later 1 year later 2 years later

Performance of average stock bought, relative to the average stock sold

Source: UC Berkeley Professor Terrence Odean, based on trading histories of 64,000 accounts at a discount brokerage firm

7

Frozen versus actual portfolios

This is another illustration showing

that the average thing we do is a mistake

Consider what would happen if an

adviser had frozen into place his/her portfolio at the beginning of the year

  • Would this frozen portfolio at the end of

the year be ahead or behind his actual trading portfolio?

8

slide-3
SLIDE 3

2017-04-15 3

Degree to which frozen portfolios beat actual portfolios (annualized average)

0.50% 0.60% 0.70% 0.80% 0.90% 1.00% Newsletters Mutual funds* *The Structure and Performance of the Money Management Industry, by Josef Lakonishok (University

  • f Illinois at Urbana-Champaign;) Andrei Shelifer (Harvard); Robert Vishny (University of Chicago)

9

But what about the best performers?

These results—which reflect the

average across large universes— wouldn’t have to be devastating if there were some way of doing better than average

That turns out to be a big if. There’s precious little evidence that

going with the past’s winners improves your odds of future success

The most robust correlations exist at

the bottom of the rankings

10

Regression to the mean

0% 10% 20% 30% 40% 50% 60% 70% 80% 90% 100% Top 10% 2 3 4 5 6 7 8 9 Bottom 10% Average percentile rank in year t+1 Decile of performance ranking in year t Expectation if investment success were a matter of pure luck

11

Why are these results so dismal?

Luck plays a far bigger role in

investment performance than skill

Our psychology makes things even

worse

12

slide-4
SLIDE 4

2017-04-15 4

Measuring luck versus skill

First method comes from Brad

Cornell, Visiting Professor of Financial Economics at Caltech

Approach is elegantly simple:

  • Compare the variance of returns
  • ver shorter and longer periods
  • The greater variance of shorter-

period performance must be due to luck

13

Professor Cornell’s finding

Among large-cap mutual funds,

“approximately 92% of the cross- sectional variation in annual performance is attributable to random chance.”

When I applied Cornell’s methodology

to invest newsletters, I reached an almost identical result: 91.86% is due to luck.

14

Measuring luck versus skill

Another approach comes

Michael Mauboussin, head of Global Financial Strategies at Credit Suisse

His insight: The quicker

performance regresses to the mean, the greater role that luck must be playing

Recall that we saw on a

previous slide that regression to the mean in investing is almost total from one year to the next

15

Mauboussin’s conclusion

Source: The Success Equation: Untangling Skill and Luck in Business, Sports, and Investing, by Michael Mauboussin

16

slide-5
SLIDE 5

2017-04-15 5

Benjamin Graham on luck

“One lucky break, or one

supremely shrewd decision—can we tell them apart?—may count for more than a lifetime of journeyman efforts.”

17

Lessons learned

Don’t so something stupid

  • Avoiding the biggest mistakes is probably

the most important thing we can do

The strongest statistical patterns are

among the worst performers.

  • It’s a better bet that a terrible performer

will remain a terrible performer than that a top performer will remain top-ranked

18

Lessons learned

Don’t just do something, sit there!

  • The fewer things you do, the better

If you nevertheless do decide to do

something

  • Do so for reasons/trading rules you have

specified in advance, not how you feel in the moment

19

Another lesson: Patience and discipline

Patience is essential because no one

is able to beat the market all the time

You shouldn’t give up on a strategy

just because it lags the market along the way

  • This is a high hurdle, since losing money

and lagging the market are no strangers to market beating advisers

20

slide-6
SLIDE 6

2017-04-15 6

Incidence of lagging/losses among market-beating advisers

0% 5% 10% 15% 20% 25% 30% 35% 40% 45% 50% Lost money Lagged market Last 10 calendar years Last 20 calendar years % of rolling 5 year periods last 20 years

21

This makes it difficult to conclude statistically that you should get rid

  • f your adviser or strategy

You need many data points before you can

conclude at the 95% confidence level that an adviser has lost his/her touch

The large variability in short-term results

means you need an even larger number of data points before reaching such a conclusion

Your relationship with an adviser is closer to

a marriage than to a one-night stand…

22

Consider a strategy that invests in Value Line’s Group 1 stocks

This strategy on balance has

  • utperformed the market by a large

margin over the last 40 years

Since 2009, however, this strategy has

significantly lagged the market (see chart on following page)

Is this several-year period of

underperformance enough to conclude that the Value Line ranking system no longer works?

23

Value Line’s Group 1 stocks since 1980

0.80 1.00 1.20 1.40 1.60 1.80 2.00 1980 1985 1990 1995 2000 2005 2010 2015 Cumulative performance relative to Wilshire 5000 index since mid-1980 Value Line outper- forming Wilshire 5000 Value Line under-performing Wilshire 5000

24

slide-7
SLIDE 7

2017-04-15 7

Premature to give up on it!

At the 95% confidence level, you

cannot conclude that the data series since the 2009 inflexion is different than what came before

25

Another lesson: Keep risk low

Given the predominant role that luck plays in

investment performance, it’s crucial to keep risk low

That’s because high risk inevitably leads to

losses so big that recovery becomes unlikely

The next slide plots newsletters’ returns over

the trailing 20 years against their risk levels.

  • Notice that once risk exceeds that of the overall

market’s, even the best performers earn very little extra return—and the worst performers lose big

  • Notice also that the trendline that best fits the

data points is downward sloping

26

Risk versus reward last 20 years

  • 20%
  • 15%
  • 10%
  • 5%

+0% +5% +10% +15% +20% 0.0 0.5 1.0 1.5 2.0 2.5 3.0 3.5 4.0 20-year annualized return Risk as measured by volatility of monthly returns; stock market = 1.0 Stock market's risk level Best-fit trendline

27

Yet another reason to keep risk low

The future is far more unknowable

than we think it is

28

slide-8
SLIDE 8

2017-04-15 8

How much do we really know about the future?

We assume that things will work out,

so long as we hold on long enough

0% 2% 4% 6% 8% 10% 12% 14% 16% 18% 20% 1 2 5 10 20 30 Holding period (in years) Standard deviation of returns

Source: Jeremy Siegel, Stocks For The Long Run

29

But how valid is this assumption?

Consider all the forces that could

prevent the equity markets over the next 30 years from equaling their historical average return of 11% annualized

Might the range of possible

consequences of those other forces actually increase with time horizon?

  • Of course!

30

Climate change: Just one possible long-term force

Consider first the range of possible

economic consequences of climate change over the coming 12 months.

  • The difference between the most dire

scenario and the most benign is virtually undetectable at the 12-month time horizon

Now consider the range of possible

consequences at the 30- or 50-year time horizon

  • They range from no impact to catastrophic

31

Variance relative to one-year holding periods

1 1.1 1.2 1.3 1.4 1.5 1.6 1 year 10 years 30 years

Source: Robert Stambaugh (Wharton) and Lubos Pastor (U. of Chicago)

32

slide-9
SLIDE 9

2017-04-15 9

Lessons learned

It easily could have turned out

differently over the last two centuries that stocks would produce a return of 11% annualized

  • There was nothing pre-ordained that the

US would win two world wars, a cold war, emerge as the dominant world geopolitical and economic power, etc. etc.

  • The stock market’s long-term return would

have been far less under any of a number

  • f alternate scenarios

33

Lessons learned

The last 200 years in effect represent

just one draw from the sample

To extrapolate the past into the future,

you in effect have to bet that events as momentous as winning two world wars, a cold war, etc. etc. will all fall in favor of the U.S. in coming decades

  • Furthermore, these all will have to be

surprises; they can’t already be discounted in stock prices

34

Another source of uncertainty about the future: Path dependency

Your retirement wealth is a function

not just of how the stock and bond markets perform over your lifetime

It’s also a function of the path those

markets took along the way

Drawdowns near your retirement age

have a far bigger impact than drawdowns earlier in life

35

“Who ate Joe’s retirement money?”

36

slide-10
SLIDE 10

2017-04-15 10

The dos and don’ts of contrarian analysis

Contrarian analysis in effect exploits

the fact that the average thing we do is a mistake

  • Our mistakes are not randomly

distributed, in other words; they’re worse

Because of this, to quote Warren

Buffett, we should be greedy when

  • thers are fearful and fearful when
  • thers are greedy

37

Make contrarian analysis

  • bjective

The most crucial starting point: Base

your analysis on an objective measurement of sentiment

  • How do you determine when others are

greedy, and when they are fearful?

Subjective measures are dangerous, as

they risk turning contrarian analysis into little more than an excuse for sloppy thinking

  • Magazine covers
  • Subjective determinations of mood
  • Voluntary surveys

38

How I measure sentiment

We average the recommended

exposures levels among all short-term market timers on our monitored list

  • Included are only those that have the

electronic means of communicating a change

  • f recommendation

The result is a completely objective

measurement.

  • We may not agree with an interpretation of

that measurement, but the measurement itself is a fact

39

Tests of contrarian analysis

I have constructed four different

sentiment indices.

General domestic equity NASDAQ Gold Domestic bonds

Econometric tests confirm the contrarian

hypothesis: On average, the market does better following extreme low index readings than after extreme high ones

  • This tendency applies to the short-term—of
  • ne to three months at most

40

slide-11
SLIDE 11

2017-04-15 11

Average exposure among domestic equity market timers

  • 40%
  • 20%

0% 20% 40% 60% 80% 100%

15,000 16,000 17,000 18,000 19,000 20,000 21,000 22,000

DJIA Hulbert Stock Newsletter Sentiment Index

Source: 41

Average exposure among NASDAQ market timers

  • 80%
  • 60%
  • 40%
  • 20%

0% 20% 40% 60% 80% 100% 4,200 4,400 4,600 4,800 5,000 5,200 5,400 5,600 5,800 6,000

NASDAQ Composite (Left axis) Hulbert NASDAQ Newsletter Sentiment Index (Right axis)

Source: www.HulbertRatings.com 42

Average exposure among gold timers

$1,000 $1,050 $1,100 $1,150 $1,200 $1,250 $1,300 $1,350 $1,400

  • 80%
  • 60%
  • 40%
  • 20%

0% 20% 40% 60% 80% Hulbert Gold Newsletter Sentiment Index (left axis) Gold bullion (right axis) Source: www HulbertRatings com

43

Average exposure among domestic bond timers

1.20% 1.40% 1.60% 1.80% 2.00% 2.20% 2.40% 2.60% 2.80%

  • 60%
  • 40%
  • 20%

0% 20% 40% 60% 80% 100% 31-Dec-14 31-Jan-15 28-Feb-15 31-Mar-15 30-Apr-15 31-May-15 30-Jun-15 31-Jul-15 31-Aug-15 30-Sep-15 31-Oct-15 30-Nov-15 31-Dec-15 31-Jan-16 29-Feb-16 31-Mar-16 30-Apr-16 31-May-16 30-Jun-16 31-Jul-16 31-Aug-16 30-Sep-16 31-Oct-16 30-Nov-16 31-Dec-16 31-Jan-17 28-Feb-17 31-Mar-17 Hulbert Bond Newsletter Sentiment Index (Left scale) TNX (Right scale) Source: www.HulbertRatings.com

44