
SLIDE 1
1 1
The Effects of The Effects of Active Queue Management Active Queue Management
- n Web Performance
- n Web Performance
Long Le, Jay Aikat, Kevin Jeffay, and Don Smith Long Le, Jay Aikat, Kevin Jeffay, and Don Smith The The UNIVERSITY UNIVERSITY of
- f NORTH CAROLINA
NORTH CAROLINA at at CHAPEL HILL CHAPEL HILL
http://www.cs.unc.edu/Research/dirt
SIGCOMM SIGCOMM 2003 2003
2 2
The Effects of Active Queue The Effects of Active Queue Management on Web Performance Management on Web Performance
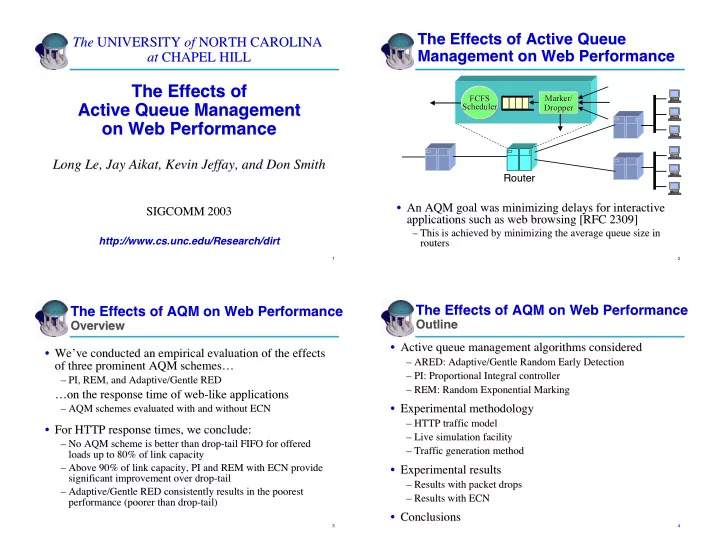
- An AQM goal was minimizing delays for interactive
An AQM goal was minimizing delays for interactive applications such as web browsing [RFC 2309] applications such as web browsing [RFC 2309]
– – This is achieved by minimizing the average queue size in This is achieved by minimizing the average queue size in routers routers
FCFS FCFS Scheduler Scheduler
Router Router
Marker/ Marker/ Dropper Dropper
3 3
The Effects of AQM on Web Performance The Effects of AQM on Web Performance
Overview Overview
- We
We’ ’ve conducted an empirical evaluation of the effects ve conducted an empirical evaluation of the effects
- f three prominent AQM schemes
- f three prominent AQM schemes…
…
– – PI, REM, and Adaptive/Gentle RED PI, REM, and Adaptive/Gentle RED
… …on the response time of web-like applications
- n the response time of web-like applications
– – AQM schemes evaluated with and without ECN AQM schemes evaluated with and without ECN
- For HTTP response times, we conclude:
For HTTP response times, we conclude:
– – No AQM scheme is better than drop-tail FIFO for offered No AQM scheme is better than drop-tail FIFO for offered loads up to 80% of link capacity loads up to 80% of link capacity – – Above 90% of link capacity, PI and REM with ECN provide Above 90% of link capacity, PI and REM with ECN provide significant improvement over drop-tail significant improvement over drop-tail – – Adaptive/Gentle RED consistently results in the poorest Adaptive/Gentle RED consistently results in the poorest performance (poorer than drop-tail) performance (poorer than drop-tail)
4 4
The Effects of AQM on Web Performance The Effects of AQM on Web Performance
Outline Outline
- Active queue management algorithms considered
Active queue management algorithms considered
– – ARED: Adaptive/Gentle Random Early Detection ARED: Adaptive/Gentle Random Early Detection – – PI: Proportional Integral controller PI: Proportional Integral controller – – REM: Random Exponential Marking REM: Random Exponential Marking
- Experimental methodology
Experimental methodology
– – HTTP traffic model HTTP traffic model – – Live simulation facility Live simulation facility – – Traffic generation method Traffic generation method
- Experimental results
Experimental results
– – Results with packet drops Results with packet drops – – Results with ECN Results with ECN
- Conclusions