
SLIDE 1
Mapping and modelling infection movements in low income regions - - PowerPoint PPT Presentation
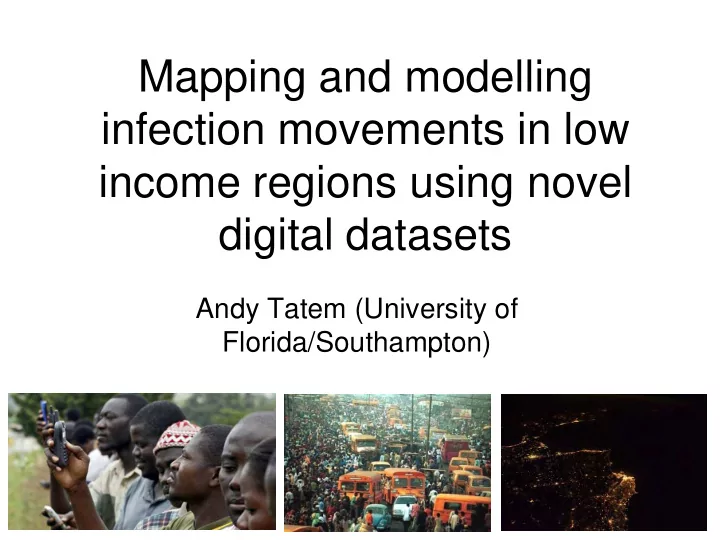
Mapping and modelling infection movements in low income regions using novel digital datasets Andy Tatem (University of Florida/Southampton) Human mobility Human movements and disease Stoddard, Morrison, Vazquez-Prokopec et al (2009) PLoS
Stoddard, Morrison, Vazquez-Prokopec et al (2009) PLoS Negl.Trop.Dis
Brockmann, Hufnagel, Geisel (2006) Nature Pybus, Suchard, Lemey et al (2012) PNAS Tatem, Huang, Das et al (2012) Parasitology
Le Menach, Tatem, Cohen et al (2011) Nature Scientific Reports Cosner, Beier, Cantrell et al (2009) J Theoretical Biology
User makes a call from location X User travels to Y and makes a call X Y Call routed through nearest tower Network operator records time and tower of call for billing
Advantages
Disadvantages
How many infections are being imported? When? From where? Where are the likely sources of imported infections? Where are they going? Where is community X most likely to import/export infections from/to? How can we make efficient use of these data to target surveillance and control?
Tatem, Qiu, Smith et al (2009) Malaria Journal
δr = Nr 1− 1+ αbETr
−1α
infections Heterogeneous biting Length of stay Person visits Transmission efficiency Transmission seasonality Population Le Menach, Tatem, Cohen et al (2011) Nature Scientific Reports Tatem, Qiu, Smith et al (2009) Malaria Journal
Bharti, Djibo, Ferrari et al (2010) Epidemiology and Infection
Agnew, Gillespie, Gonzalez et al (2008) Environment and Planning A
Bharti, Tatem, Ferrari et al (2011) Science
Bharti, Tatem, Ferrari et al (2011) Science
mobile phone usage data (Kenya, Tanzania, Namibia, Rwanda, Indonesia, Dominican Republic)
Microdata and survey movement patterns
Satellite night-time light fluctuations
Dave Smith, Arnaud le Menach (Johns Hopkins), Deepa Pindolia, Andres Garcia, Youliang Qiu, Zhuojie Huang, Udayan Kumar (UF), Simon Hay, Pete Gething (Univ. Oxford), Robert Snow, Abdisalan Noor (Kenya Medical Research Institute), Abdullah Ali (ZMCP), Bruno Moonen, Justin Cohen, Chris Lourenco, Deepika Kandula (Clinton Foundation), Nita Bharti, Matt Ferrari (Penn State), Bryan Grenfell (Princeton), Caroline Buckee (Harvard), Amy Wesolowski (Carnegie Mellon), Nathan Eagle (MIT), Alex Perkins, Tom Scott (UC Davis), Gonzalo Prokopec (Emory)