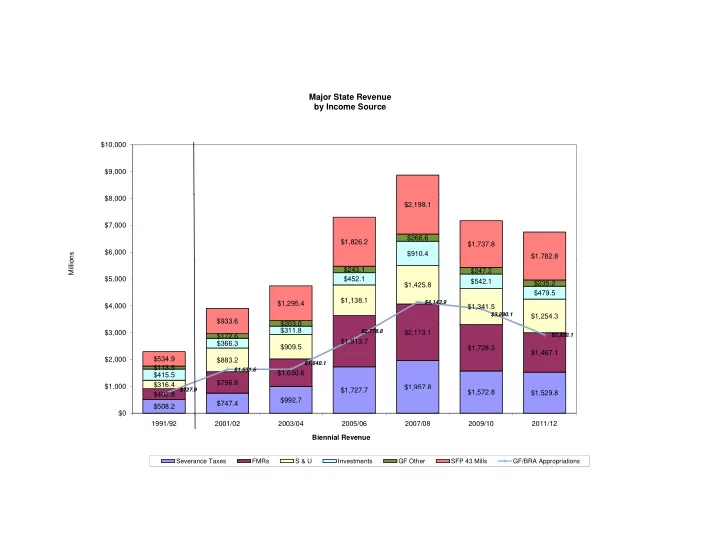
SLIDE 1 Major State Revenue by Income Source
$9,000 $10,000 $910.4 $266.6 $1,826.2 $2,198.1 $1,737.8 $1,782.8 $6,000 $7,000 $8,000
$1,138.1 $1,425.8 $1,341.5 $1,254.3 $452.1 $542.1 $479.5 $203 0 $243.1 $247.2 $235.2 $933.6 $1,295.4
$4,143.9 $3,890.1
$4,000 $5,000 Millio $1 727 7 $1,957.8 $1 572 8 $ $796.8 $1,030.6 $1,913.7 $2,113.1 $1,728.3 $1,467.1 $316.4 $883.2 $909.5 $415.5 $366.3 $311.8 $113.5 $172.6 $203.0 $534.9
$727 9 $1,631.6 $1,640.1 $2,778.8 $2,920.1
$1,000 $2,000 $3,000 $508.2 $747.4 $992.7 $1,727.7 $ , $1,572.8 $1,529.8 $402.8
$727.9
$0 1991/92 2001/02 2003/04 2005/06 2007/08 2009/10 2011/12 Biennial Revenue
Severance Taxes FMRs S & U Investments GF Other SFP 43 Mills GF/BRA Appropriations
Slide #1 Source: LSO Budget/Fiscal Division
SLIDE 2
Table 9 Total State Assessed Valuation Calendar Other Minerals Other Grand Year Oil Gas Coal Trona Minerals Totals Property Totals Historical: 1985 $2,889,361,320 $1,238,247,618 $1,256,360,635 $96,839,980 $34,112,330 $5,514,921,883 $2,315,793,094 $7,830,714,977 1986 $1,440,262,656 $889,888,628 $1,111,486,981 $105,566,325 $34,343,639 $3,581,548,229 $2,391,141,893 $5,972,690,122 1987 $1,726,056,828 $717,673,951 $1,006,229,601 $114,546,971 $23,035,941 $3,587,543,292 $2,306,599,106 $5,894,142,398 1988 $1,386,610,892 $719,589,653 $1,170,706,216 $116,918,544 $44,568,666 $3,438,393,971 $2,291,292,385 $5,729,686,356 1989 $1,657,596,044 $771,209,008 $1,157,292,224 $150,600,216 $36,116,824 $3,772,814,316 $2,301,616,736 $6,074,431,052 1990 $1,944,312,061 $802,742,792 $1,128,751,476 $179,396,884 $39,969,271 $4,095,172,484 $2,291,841,199 $6,387,013,683 1991 $1,525,148,746 $754,046,591 $1,124,208,895 $191,288,342 $46,795,746 $3,641,488,320 $2,412,091,802 $6,053,580,122 1992 $1,392,784,056 $866,037,624 $1,124,159,350 $195,116,349 $41,901,658 $3,619,999,037 $2,555,050,886 $6,175,049,923 1993 $1,145,997,408 $1,070,372,528 $1,087,819,590 $178,541,871 $41,043,459 $3,523,774,856 $2,767,438,446 $6,291,213,302 1994 $976,428,678 $982,669,079 $1,134,921,050 $174,696,366 $47,646,972 $3,316,362,145 $2,915,392,514 $6,231,754,659 1995 $1,046,253,644 $777,111,224 $1,190,504,945 $235,924,659 $48,523,309 $3,298,317,781 $3,125,083,074 $6,423,400,855 1996 $1,262,398,254 $1,079,831,210 $1,217,201,878 $258,344,864 $58,353,020 $3,876,129,226 $3,269,740,086 $7,145,869,312 1997 $1,094,434,115 $1,432,024,354 $1,168,819,736 $259,007,520 $63,325,758 $4,017,611,483 $3,423,859,455 $7,441,470,938 1998 $617,510,781 $1,306,590,501 $1,204,528,349 $242,352,415 $64,727,912 $3,435,709,958 $3,589,768,423 $7,025,478,381 1999 $903,869,245 $1,601,520,736 $1,265,306,376 $211,143,740 $65,617,392 $4,047,457,489 $3,849,398,782 $7,896,856,271 2000 $1,438,975,976 $3,365,840,728 $1,336,115,591 $206,218,970 $59,908,980 $6,407,060,245 $4,135,036,155 $10,542,096,400 2001 $1,080,018,231 $3,882,089,465 $1,506,337,295 $209,191,934 $61,089,137 $6,738,726,062 $4,430,580,865 $11,169,306,927 2002 $1,083,555,330 $2,512,574,992 $1,760,291,304 $203,324,146 $64,567,181 $5,624,312,953 $4,715,774,001 $10,340,086,954 2003 $1,244,211,776 $5,265,135,004 $1,846,983,332 $195,203,377 $64,488,534 $8,616,022,023 $5,063,514,295 $13,679,536,318 2004 $1,634,067,860 $7,039,052,884 $2,039,556,051 $198,943,291 $72,397,802 $10,984,017,888 $5,461,066,596 $16,445,084,484 2005 $2,152,842,718 $10,134,180,366 $2,280,138,621 $255,216,361 $83,997,233 $14,906,375,299 $6,072,284,471 $20,978,659,770 2006 $2,533,149,964 $8,770,228,320 $2,884,925,775 $299,227,941 $98,848,458 $14,586,380,458 $6,904,886,980 $21,491,267,438 2007 $2,843,196,944 $7,271,144,479 $3,279,547,772 $339,684,701 $111,630,388 $13,845,204,284 $8,053,126,913 $21,898,331,197 2008 $4,089,269,385 $12,003,450,988 $3,760,527,297 $427,193,253 $116,440,939 $20,396,881,862 $8,822,651,321 $29,219,533,183 Projected: 2009 $2,239,900,000 $5,019,700,000 $3,711,900,000 $368,900,000 $97,000,000 $11,437,400,000 $8,822,700,000 $20,260,100,000 2010 $2,414,100,000 $5,354,300,000 $3,166,300,000 $297,200,000 $98,700,000 $11,330,600,000 $8,822,700,000 $20,153,300,000 2011 $2,579,300,000 $6,441,400,000 $2,882,600,000 $297,200,000 $107,000,000 $12,307,500,000 $8,999,200,000 $21,306,700,000 2012 $2,952,100,000 $8,428,900,000 $2,910,700,000 $300,700,000 $107,000,000 $14,699,400,000 $9,179,200,000 $23,878,600,000 2013 $3,301,400,000 $9,623,000,000 $3,100,000,000 $306,000,000 $107,000,000 $16,437,400,000 $9,362,800,000 $25,800,200,000 2014 $3,632,700,000 $10,884,600,000 $3,292,400,000 $311,300,000 $107,000,000 $18,228,000,000 $9,550,100,000 $27,778,100,000
January 2010 Table 9
Slide #2 Slide #2 Source: CREG January 2010 Forecast Report
SLIDE 3 Table 5 Mineral Severance Taxes Biennial Distribution by Account Cities, Towns, Counties and Special General Budget Highway Cities and School Community Districts Capital State Aid Biennium Fund Reserve Acct PWMTF Water I Water II Water III Fund Towns Counties Foundation Colleges Construction County Roads Others Totals (1) (2) (3),(4) (3),(4) (3) (2) (5),(6) (7) Historical: 1985-86 $222,234,970 $0 $256,010,186 $36,246,979 $14,620,805 $0 $107,500,915 $65,793,618 $21,931,206 $12,171,961 $4,057,320 $0 $0 $49,347,554 $789,915,514 1987-88 $135,168,044 $2,717,761 $121,086,955 $31,291,691 $7,844,277 $0 $73,174,196 $35,299,241 $11,766,414 $10,411,873 $3,470,624 $0 $0 $56,736,308 $488,967,384 1989-90 $139,232,319 $59,880,367 $107,136,586 $30,999,922 $8,205,682 $0 $69,407,525 $36,925,569 $12,308,523 $10,865,558 $3,621,852 $0 $0 $3,309,044 $481,892,947 1991-92 $146,602,750 $64,681,142 $112,766,211 $36,775,081 $8,451,356 $0 $69,062,766 $38,031,100 $12,677,033 $12,195,441 $4,065,147 $0 $0 $2,904,537 $508,212,564 1993-94 $131,050,025 $84,045,168 $105,345,165 $32,029,939 $7,683,223 $0 $39,847,929 $34,574,394 $11,524,798 $16,083,054 $1,969,302 $0 $0 $14,670,775 $478,823,772 1995-96 $118,127,750 $56,318,690 $92,130,218 $32,790,619 $5,944,352 $0 $17,071,769 $26,749,432 $10,697,806 $133,602 $44,534 $6,443,688 $6,412,786 $14,960,377 $387,825,623 1997-98 $140,464,016 $66,649,935 $111,623,683 $36,696,834 $7,309,142 $0 $14,689,945 $32,890,946 $13,520,581 $124,074 $41,358 $8,628,094 $9,072,125 $18,603,760 $460,314,493 1999-00 $142,540,766 $67,246,815 $118,384,323 $36,163,949 $7,532,101 $0 $9,108,600 $33,894,627 $13,880,803 $6,229,922 $4,875 $7,741,963 $9,336,662 $19,516,774 $471,582,180 2001-02 $256,289,927 $97,185,642 $185,264,887 $40,102,845 $12,826,869 $0 $35,965,577 $48,231,930 $21,974,954 $24,070 $2,674 $9,369,034 $10,088,546 $30,080,284 $747,407,239 2003-04 $333,957,708 $276,758,652 $240,798,812 $39,101,441 $6,736,790 $0 $14,667,344 $29,633,614 $12,429,714 $0 $0 $8,786,528 $8,995,031 $20,827,516 $992,693,150 2005-06 $465,530,763 $531,160,140 $583,525,161 $38,475,804 $7,231,005 $775,114 $16,227,296 $31,833,340 $13,195,534 $0 $0 $7,998,065 $8,990,056 $22,791,494 $1,727,733,772 2007-08 $471,823,721 $551,893,115 $789,669,768 $39,335,587 $6,723,572 $1,550,360 $14,770,346 $29,635,346 $12,348,525 $0 $0 $7,223,159 $8,990,152 $23,787,280 $1,957,750,931 Projected: 2009-10 $398,480,767 $409,183,694 $623,804,682 $38,597,501 $6,643,659 $1,575,104 $13,765,973 $29,036,265 $12,147,028 $0 $0 $7,211,541 $8,995,030 $23,311,918 $1,572,753,162 2011-12 $387,100,000 $388,100,000 $612,900,000 $38,600,000 $6,600,000 $1,600,000 $13,400,000 $28,600,000 $12,000,000 $0 $0 $7,200,000 $9,000,000 $24,700,000 $1,529,800,000 2013-14 $473,700,000 $561,500,000 $801,900,000 $38,600,000 $6,600,000 $1,600,000 $13,400,000 $28,600,000 $12,000,000 $0 $0 $7,200,000 $9,000,000 $25,400,000 $1,979,500,000 (1) - (2) - (3) - (4) - (5) - (6) - (7) - Chapter 62, 2002 Session Laws made permanent the diversion of PWMTF revenues to the Severance Tax Distribution Account, and repealed the language of Chapter 99, 2000 Session Laws requiring a larger proportion of coal bed methane revenues to be deposited into the PWMTF. Chapter 80, 2005 Session Laws diverts additional severance taxes (equal to two-thirds of the PWMTF distribution required by Wyoming Constitution) from the Severance Tax Distribution Account to the PWMTF, beginning in FY06. One-half of the addtional severance taxes to the PWMTF ($54,750,000) will be diverted to the PWMTF Reserve Account in FY10. The drop in revenues to these accounts in FY94 was due to the expiration of the Capital Facilities Tax on coal and trona. Chapter 163, 2005 Session Laws creates a severance tax distribution to Water Development Account III of 0.5 percent and decreases the distribution to Local Government Capital Construction from 2.83 percent to 2.33 percent, beginning in FY06. FY98 revenues include $8.0 million in previously protested severance taxes on coal from prior production years. FY06 and FY07 revenues include $19.5 million and $13.3 million respectively in previously protested severance taxes on natural gas from prior production years. In FY99 and FY00, mineral severance taxes and federal mineral royalties were diverted from the Highway Fund to the School Foundation Program until $20 million was received. This revenue diversion from the Highway fund was offset with additional fuel tax revenue. In FY01 and FY02, the diversion of revenues from these sources continued, however, the amount was not limited to a fixed dollar amount, but was a dollar for dollar swap in the amount raised by the fuel tax. Beginning in FY92, the totals shown in this column have included diversions from the Highway Fund to the LUST accounts (Financial Responsibility and Corrective Action accounts). Amounts from $12.1 to $12.8 million per year are projected to be diverted to these accounts in FY10 through FY14. This column includes $5.5 million of Municipal Mineral Trust Fund monies in FY 2001. These funds were diverted from the cities & towns portion of severance taxes when the total severance taxes to those entities exceeded $24 million in any year, under the distribution formulas in place prior to Chapter 209, 2001 Session Laws.
January 2010 Table 5
Slide #3 Source: CREG January 2010 Forecast Report
SLIDE 4
Table 8 Federal Mineral Royalties (Including Coal Lease Bonuses) - Projections Biennial Distribution by Account Cities, Towns, Counties and Spec University of School Highway Highway Fund Cities and Districts Capital School Dist State Aid to Community Transportation General Fund Biennium Wyoming Foundation Fund County Roads Towns Construction Cap Con Counties County Roads LRI/BRA Colleges Others Enterprise Administrative Totals (1) (2),(3),(7) (2),(4) (4) (4),(5),(7) (1),(5),(7) (4) (3) (6) Historical: 1985-86 $27,416,996 $137,005,443 $103,101,378 $8,837,261 $29,457,536 $37,180,426 $32,669,968 $0 $8,837,261 $7,722,889 $16,888,988 $0 $0 $0 $409,118,146 1987-88 $18,848,695 $115,409,040 $73,300,478 $6,282,899 $20,942,794 $27,356,814 $10,545,353 $0 $6,282,899 $6,413,820 $6,684,567 $0 $0 $0 $292,067,359 1989-90 $23,200,269 $153,981,044 $90,223,268 $7,733,423 $32,222,596 $17,739,201 $9,280,108 $2,148,173 $7,733,423 $553,816 $0 $0 $0 $0 $344,815,321 1991-92 $27,056,780 $178,546,135 $93,657,013 $8,967,161 $37,363,170 $20,833,262 $10,760,593 $2,490,878 $19,927,025 $2,314,158 $0 $925,051 $0 $0 $402,841,226 1993-94 $23,493,018 $155,924,027 $91,361,734 $7,831,006 $32,629,191 $31,064,052 $9,397,207 $2,175,280 $7,831,006 $19,661,817 $0 $6,000,000 $0 $0 $387,368,338 1995-96 $24,878,575 $165,120,021 $111,387,814 $8,292,858 $34,553,576 $32,459,603 $9,951,430 $522,242 $1,880,072 $16,379,774 $4,094,944 $0 $0 $0 $409,520,909 1997-98 $29,853,916 $180,636,101 $125,987,924 $9,072,126 $37,797,995 $25,979,285 $13,210,604 $0 $0 $32,833,340 $2,811,383 $3,415,980 $0 $0 $461,598,654 1999-00 $33,305,952 $200,495,856 $104,766,870 $9,375,764 $38,227,302 $26,876,275 $57,636,869 $0 $0 $46,949,577 $3,200,000 $7,545,467 $11,742,000 $0 $540,121,932 2001-02 $30,145,519 $263,644,646 $85,275,180 $10,048,506 $39,590,638 $27,997,511 $110,402,400 $0 $0 $189,477,455 $3,200,000 $20,503,245 $14,484,000 $2,000,000 $796,769,100 2003-04 $26,730,000 $347,353,273 $124,035,000 $8,910,000 $37,125,000 $26,100,000 $113,394,374 $0 $0 $339,788,599 $3,200,000 $0 $0 $4,000,000 $1,030,636,246 2005-06 $26,730,000 $289,876,871 $124,035,000 $8,910,000 $37,125,000 $26,100,000 $417,121,600 $0 $0 $725,995,853 $3,200,000 $250,637,965 $0 $4,000,000 $1,913,732,289 2007-08 $26,730,000 $375,947,293 $124,035,000 $8,910,000 $37,125,000 $26,100,000 $347,186,409 $0 $0 $905,530,970 $3,200,000 $254,362,035 $0 $4,000,000 $2,113,126,707 Projected: 2009-10 $26,765,000 $533,214,799 $124,017,500 $8,955,000 $37,162,500 $26,150,000 $253,376,037 $0 $0 $711,495,060 $3,200,000 $0 $0 $4,000,000 $1,728,335,896 2011-12 $26,800,000 $501,500,000 $124,000,000 $9,000,000 $37,200,000 $26,200,000 $87,000,000 $0 $0 $648,200,000 $3,200,000 $0 $0 $4,000,000 $1,467,100,000 2013-14 $26,800,000 $623,800,000 $122,100,000 $9,000,000 $37,200,000 $20,500,000 $30,800,000 $0 $0 $892,900,000 $1,600,000 $0 $0 $4,000,000 $1,768,700,000 (1) - (2) - (3) - (4) - (5) - (6) - (7) - Federal legislation was enacted in December 2007 to reduce the state's share of federal mineral royalties by 2%, beginning in FY08. This revenue decrease will reduce distributions to the School Foundation Program Account, the School Capital Construction Account, and the Budget Reserve Account. Under the distribution formula in place for FY00, 6.75% of all mineral royalties in excess of $200 million would normally flow to the University when that entity's bonded indebtedness necessitated the expenditure of those funds. Because the University's bonds issued under this provision of law were retired, the LRI received the amount that otherwise would have flowed to the University, approximately $12.2 million. In FY99 and FY00, mineral severance taxes and federal mineral royalties were diverted from the Highway Fund to the School Foundation Program until $20 million was received. This revenue diversion from the Highway fund was offset with additional fuel tax revenue. In FY01 and FY02, the diversion of revenues from these sources continued, however, the amount was not limited to a fixed dollar amount, but was a dollar for dollar swap in the amount raised by the fuel tax. The state receives coal lease bonus revenue, which is currently distributed to these specific funds. Total coal lease bonus revenue in FY09 was $213,630,037. The projected coal lease bonuses for the forecast period are $47.2 million per year in FY10-12, and $29.3 million in FY13. Chapter 190, 2005 Session Laws diverts federal mineral royalties over the $200 million cap from the School Foundation Program (SFP) to the Higher Education Endowment Account and Hathaway Endowment Account, beginning in FY05. Amounts diverted are reduced as necessary to ensure an unobligated, unencumbered balance of $100 million in the SFP as of July 1 of each fiscal year. Of the amounts diverted, 21 percent is distributed to the Higher Education Endowment Account until the account balance reaches $105 million, and 79 percent is distributed to the the Hathaway Endowment Account until the account balance reaches $400 million. These distributions were completed in FY08. Beginning in FY98, coal lease bonus revenues normally flowing to the Legislative Royalty Impact Assistance Account have been diverted to the School District Capital Construction Account. In FY99, $4.5 million of Highway Fund federal mineral royalties were diverted to the Transportation Enterprise Account. In fiscal years 2000-02, $7,242,000 in highway FMR funds were diverted to this account.
January 2010 Table 8 Slide #4 Source: CREG January 2010 Forecast Report
SLIDE 5 Major State Revenue by Account of Deposit
$9,000 $10,000 $347.2 $1,564.6 $1,860.5 $1,411.2 $1 373 8 $6 000 $7,000 $8,000 $2,252.1 $2,816.4 $2,393.7 $2,391.1 $113.4 $417.1 $253.4 $87.0 $894.0 $1,373.8
$4,143.9 $3,890.1
$4,000 $5,000 $6,000 Millions $3,067.2 $3,847.6 $3,111.4 $2,896.8 $860 3 $1,311.7 $1,749.8 $10.8 $110.4 $584.5 $900.9
$1,631.6 $1,640.1 $2,778.8 $2,920.1
$2,000 $3,000 $835.8 $1,576.8 $1,985.8 $860.3
$727.9
$0 $1,000 1991/92 2001/02 2003/04 2005/06 2007/08 2009/10 2011/12 Biennial Revenue
GF/BRA SFP SCCA Others GF/BRA Appropriations
Slide #5 Source: LSO Budget/Fiscal Division
SLIDE 6
2011/12 Biennium Projected Major State Revenues by Account with $2.9 Billion GF/BRA Revenue Sources $6.75 Billion Total
SFP $2,391,080,000 Sales & Use Tax $865,500,000 35% FMRs $648,200,000 Severance Tax GF/BRA $2,896,800,000 43% Other Accounts $1,373,847,826 20% Severance Tax $775,200,000 Investment Earnings $372,700,000 Other GF Source SCCA $87,000,000 1% $235,200,000 Slide #6 Source: LSO Budget/Fiscal Division
SLIDE 7 SFP $2,391,080,000
$18,585,942
UW CCs $627,598,991
$860 457 158
2011/12 Biennium Projected Major State Revenues by Account with $2.9 Billion GF/BRA Expenditure Categories
SCCA $87,000,000 1% Other Accounts $1,373,847,826 20% 35% $860,457,158
Safety, Corrections $436,078,118
$166,540,280
Development $122,734,227
$139,112,400
$225,469,560
$323,553,324
Slide #7 Source: LSO Budget/Fiscal Division
SLIDE 8 Appropriations from General Fund and Reserve Accounts - Ongoing by Category and extras as of March 5, 2010
March 5, 2010 Biennium 01-02 03-04 05-06 07-08 09-10 11-12
130,863,790 54,302,291 25,472,289 84,971,936 17,918,297 18,585,942
- 1b. Higher Education (UW, Community Colleges)
325,081,699 397,837,022 457,465,764 547,175,701 615,016,424 627,598,991
353,472,105 457,675,472 592,289,069 771,569,498 808,948,485 860,457,158
- 3. Justice, Public Safety and Corrections
188,962,920 233,498,179 277,410,997 349,737,798 399,077,758 436,078,118
76,879,168 100,760,018 115,137,758 160,739,922 166,692,786 166,540,280
- 5. Employment, Econ. Dev. and Commerce
50,645,327 58,646,388 79,268,127 134,911,871 128,838,516 122,734,227 Natural Resources, Environment and Recreation 31,022,919 43,570,656 89,653,956 145,426,347 154,768,276 139,112,400
- 7. Transportation
- 8. General government
129,252,024 159,768,047 170,789,425 233,431,954 214,293,195 225,469,560 subtotal of ongoing by category 1,286,179,952 1,506,058,073 1,807,487,385 2,427,965,027 2,505,553,737 2,596,576,676 Major "extra" spending programs 195,442,233 74,016,357 670,336,203 1,197,934,597 1,009,448,707 311,815,113 Total type 3 appropriations for all programs 1,481,622,185 1,580,074,430 2,477,823,588 3,625,899,624 3,515,002,444 2,908,391,789 Savings (PWMTF, PWMTF SPRA, LSRA) 150,000,000 60,000,000 300,988,185 517,972,101 375,135,516 11,738,211 Total type 3 appropriations with savings 1,631,622,185 1,640,074,430 2,778,811,773 4,143,871,725 3,890,137,960 2,920,130,000 GF and BRA revenues 1,576,829,971 1,985,784,713 3,067,164,311 3,847,633,182 3,111,396,384 2,896,800,000
Slide #8 Source: LSO Budget/Fiscal Division
SLIDE 9 Appropriations from General Fund and Reserves - Ongoing by Category and extras, with Actual FY 2010 Budget Reductions through 11-12 as of March 5, 2010
- 1a. Ed( K-12)
- 1b. U.W. & Colleges
- 2. Health
- 3. Justice,Corr.
- 4. Family Services
- 5. Employ,Econ Dev
- 6. Nat. Res.
- 8. Gen. Gov.
extras $0 $500,000,000 $1,000,000,000 $1,500,000,000 $2,000,000,000 $2,500,000,000 $3,000,000,000 $3,500,000,000 $4,000,000,000 extras $195,442,233 $74,016,357 $670,336,203 $1,197,934,597 $1,009,448,707 $311,815,113
$129,252,024 $159,768,047 $170,789,425 $233,431,954 $214,293,195 $225,469,560
$31,022,919 $43,570,656 $89,653,956 $145,426,347 $154,768,276 $139,112,400
$50,645,327 $58,646,388 $79,268,127 $134,911,871 $128,838,516 $122,734,227
$76,879,168 $100,760,018 $115,137,758 $160,739,922 $166,692,786 $166,540,280
$188,962,920 $233,498,179 $277,410,997 $349,737,798 $399,077,758 $436,078,118
$353,472,105 $457,675,472 $592,289,069 $771,569,498 $808,948,485 $860,457,158
$325,081,699 $397,837,022 $457,465,764 $547,175,701 $615,016,424 $627,598,991
$130,863,790 $54,302,291 $25,472,289 $84,971,936 $17,918,297 $18,585,942 01-02 03-04 05-06 07-08 09-10 11-12
Slide #9 Source: LSO Budget/Fiscal Division
SLIDE 10 01-02 thru 11-12 (March 5, 2010) Appropriations from GF & Reserves - Ongoing by Category & Extras with GF and BRA Revenues
- 1a. Ed( K-12)
- 1b. U.W. & Colleges
- 2. Health
- 3. Justice,Corr.
- 4. Family Services
- 5. Employ,Econ Dev
- 6. Nat. Res.
- 8. Gen. Gov.
$1,576,829,971 $1,985,784,713 $3,067,164,311 $3,847,633,182 $3,111,396,384 $2,896,800,000 $0 $500,000,000 $1,000,000,000 $1,500,000,000 $2,000,000,000 $2,500,000,000 $3,000,000,000 $3,500,000,000 $4,000,000,000 $4,500,000,000 01-02 03-04 05-06 07-08 09-10 11-12
Slide #10 Source: LSO Budget/Fiscal Division
SLIDE 11
General Fund, Budget Reserve Account and other reserve account (LRI, SRA, PWMTF Reserve) appropriations Through the 2010 General Session, with FY 2010 Budget Reductions and 2011-12 as of March 5, 2010 Major "extra" spending programs
March 5, 2010 category 01-02 03-04 05-06 07-08 09-10 11-12 Totals Capcon/Maj Maint 1a K-12 1 $44,846,621 $25,430,998 $70,277,619 Capcon/Maj Maint 1b higher ed 1 $4,832,325 $17,522,028 $93,924,050 $125,859,455 $100,701,476 $342,839,334 Capcon/Maj Maint 2 health 1 $5,800,000 $1,356,723 $974,000 $5,767,900 $13,898,623 Capcon/Maj Maint 3 justice 1 $25,122,000 $20,236,501 $184,238,866 $42,116,633 $817,132 $272,531,132 Capcon/Maj Maint 4 family services 1 $292,005 $150,000 $10,000,000 $0 $10,442,005 Capcon/Maj Maint 5 econ. dev. 1 $350,000 $300,000 $9,662,890 $18,628,253 $4,512,772 $14,598,000 $48,051,915 Capcon/Maj Maint 6 nat. rec. 1 $382,000 $14,381,154 $21,314,745 $19,958,232 $890,000 $56,926,131 Capcon/Maj Maint 8 gen. gov. 1 $8,817,282 $12,357,828 $39,673,364 $118,565,478 $122,161,887 $56,512,253 $358,088,092 Capcon/Maj Maint total 1 $90,442,233 $50,416,357 $368,818,045 $337,458,564 $253,919,399 $72,000,253 $1,173,054,851 Water Accounts (category 6) 6 nat. rec. 2 $75,000,000 $10,000,000 $50,043,656 $12,250,000 $147,293,656 Locals (category 8) 8 gen. gov. 3 $12,500,000 $123,301,364 $332,149,318 $354,975,000 $87,456,560 $910,382,242 BRC/Comm Fac (category 5) 5 econ. dev. 4 $5,000,000 $52,932,802 $85,517,198 $86,750,000 $58,500,000 $288,700,000 DOT (all programs) (category 7) 7 transportation 5 $22,487,671 $228,373,759 $234,282,011 $66,048,711 $551,192,152 UW and C.C. Endowments (category 1b) 1b higher ed 6 $30,000,000 $49,500,000 $34,650,000 $17,000,000 $131,150,000 UW facilities match (category 1b) 1b higher ed 7 $10,000,000 $46,350,000 $3,000,000 $59,350,000 Wildlife Trust (all approps) (category 6) 6 nat. rec. 8 $15,300,000 $49,850,000 $36,122,297 $9,130,013 $110,402,310 Trusts & endow. (Public TV) 1b higher ed 9 $1,500,000 $1,500,000 Trusts & endow. (Critical access, EMSS trust) 2 health 9 $4,000,000 $50,000 $4,050,000 Trusts & endow. (Cultural) 5 econ. dev. 9 $5,000,000 $5,000,000 $1,500,000 $1,900,000 $13,400,000 Trusts & endow. (military, libraries) 8 gen. gov. 9 $600,000 $5,000,000 $8,100,000 $3,000,000 $16,700,000 Total Other trusts & endowments total 9 $600,000 $10,000,000 $9,000,000 $11,150,000 $4,900,000 $35,650,000 Retirement programs (category 3) 3 justice 10 $2,496,321 $2,496,321 Retirement programs (category 8) 8 gen. gov. 10 $5,500,000 $5,500,000 $24,542,102 $13,779,576 $49,321,678 Retirement programs total 10 $5,500,000 $7,996,321 $24,542,102 $13,779,576 $51,817,999 School of Energy Resources reserve $0 $0 Total "extra" spending programs $195,442,233 $74,016,357 $670,336,203 $1,197,934,597 $1,009,448,707 $311,815,113 $3,458,993,210 Total type 3 appropriations for all programs $1,481,622,185 $1,580,074,430 $2,477,823,588 $3,625,899,624 $3,515,002,444 $2,908,391,789 $15,588,814,060 Total appropriations less "extra" programs $1,286,179,952 $1,506,058,073 $1,807,487,385 $2,427,965,027 $2,505,553,737 $2,596,576,676 $12,129,820,850
Slide #11 Source: LSO Budget/Fiscal Division
SLIDE 12 Type 3 Appropriations - Ongoing and Extras by major category, as of March 5, 2010
capcon & UW fac. match WYDOT all other extras locals, BRC, Comm. Fac. $0 $500,000,000 $1,000,000,000 $1,500,000,000 $2,000,000,000 $2,500,000,000 $3,000,000,000 $3,500,000,000 $4,000,000,000 locals, BRC, Comm. Fac. $0 $17,500,000 $176,234,166 $417,666,516 $441,725,000 $145,956,560 all other extras $105,000,000 $6,100,000 $92,796,321 $168,085,758 $76,522,297 $27,809,589 WYDOT $0 $0 $22,487,671 $228,373,759 $234,282,011 $66,048,711 capcon & UW fac. match $90,442,233 $50,416,357 $378,818,045 $383,808,564 $256,919,399 $72,000,253
$1,286,179,952 $1,506,058,073 $1,807,487,385 $2,427,965,027 $2,505,553,737 $2,596,576,676 01-02 03-04 05-06 07-08 09-10 11-12
Slide #12 Source: LSO Budget/Fiscal Division
SLIDE 13 Type 3 Appropriations - Ongoing and Extras by major category, with GF and BRA Revenues, as of March 5, 2010
capcon & UW fac. match WYDOT all other extras locals, BRC, Comm. Fac. 1,576,829,971 1,985,784,713 3,067,164,311 3,847,633,182 3,111,396,384 2,896,800,000 $0 $500,000,000 $1,000,000,000 $1,500,000,000 $2,000,000,000 $2,500,000,000 $3,000,000,000 $3,500,000,000 $4,000,000,000 $4,500,000,000 01-02 03-04 05-06 07-08 09-10 11-12
Slide #13 Source: LSO Budget/Fiscal Division
SLIDE 14 Type 3 Appropriations - Total Ongoing and Extra Appropriations by Major Category 2007-08 Biennium ($3.626 billion total)
locals, BRC, Comm. Fac. 11.52% all other extras 4.64% WYDOT 6.30% capcon & UW fac. match 10.59%
66.96%
Slide #14 Source: LSO Budget/Fiscal Division Source: LSO Budget/Fiscal Division Source: LSO Budget/Fiscal Division
SLIDE 15 Type 3 Appropriations - Total Ongoing and Extra Appropriations by Major Category 2009-10 Biennium ($3.515 billion total)
locals, BRC, Comm. Fac. 12.57% all other extras 2.18% WYDOT 6.67% capcon & UW fac. match 7.31%
71.28%
Slide #15 Source: LSO Budget/Fiscal Division
SLIDE 16 Type 3 Appropriations - Total Ongoing and Extra Appropriations by Major Category 2011-12 Biennium, as of March 5, 2010 ($2.908 billion total)
locals, BRC, Comm. Fac. 5.02% all other extras 0.96% WYDOT 2.27% capcon & UW fac. match 2.48%
89.28%
Slide #16 Source: LSO Budget/Fiscal Division
SLIDE 17
Type 3 Appropriations - Extras by major category, as of March 5, 2010
capcon & UW fac. match WYDOT all other extras locals, BRC, Comm. Fac. $0 $200,000,000 $400,000,000 $600,000,000 $800,000,000 $1,000,000,000 $1,200,000,000 $1,400,000,000 locals, BRC, Comm. Fac. $0 $17,500,000 $176,234,166 $417,666,516 $441,725,000 $145,956,560 all other extras $105,000,000 $6,100,000 $92,796,321 $168,085,758 $76,522,297 $27,809,589 WYDOT $0 $0 $22,487,671 $228,373,759 $234,282,011 $66,048,711 capcon & UW fac. match $90,442,233 $50,416,357 $378,818,045 $383,808,564 $256,919,399 $72,000,253 01-02 03-04 05-06 07-08 09-10 11-12
Slide #17 Source: LSO Budget/Fiscal Division
SLIDE 18
Type 3 Appropriations - Extras by major category, with GF and BRA Extra Revenues, as of March 5, 2010
capcon & UW fac. match WYDOT all other extras locals, BRC, Comm. Fac. $290,650,019 $479,726,640 $1,259,676,926 $1,419,668,155 $605,842,647 $300,223,324 $0 $200,000,000 $400,000,000 $600,000,000 $800,000,000 $1,000,000,000 $1,200,000,000 $1,400,000,000 $1,600,000,000 01-02 03-04 05-06 07-08 09-10 11-12
Slide #18 Source: LSO Budget/Fiscal Division
SLIDE 19
Type 3 Appropriations - Extra Appropriations by Major Category, 2007-08 Biennium ($1,197.9 million total)
locals, BRC, Comm. Fac. 34.87% all other extras 14.03% WYDOT 19.06% capcon & UW fac. match 32.04%
Slide #19 Source: LSO Budget/Fiscal Division
SLIDE 20
Type 3 Appropriations - Extra Appropriations by Major Category, 2009-10 Biennium ($1,009.4 million total)
locals, BRC, Comm. Fac. 43.76% all other extras 7.58% WYDOT 23.21% capcon & UW fac. match 25.45%
Slide #20 Source: LSO Budget/Fiscal Division
SLIDE 21
Type 3 Appropriations - Extra Appropriations by Major Category 2011-12 Biennium, as of March 5, 2010 ($311.8 million total)
locals, BRC, Comm. Fac. 46.81% all other extras 8.92% WYDOT 21.18% capcon & UW fac. match 23.09%
Slide #21 Source: LSO Budget/Fiscal Division
SLIDE 22
Direct Distributions to Local Governments and Appropriations to Grant & Loan Programs 2005-06 Biennium, 2007-08 Biennium, 2009-10 Biennium, and 2011-12 Biennium, as of March 5, 2010
Direct Distributions FY 2005-06 FY 2007-08 FY 2009-10 FY 2011-12 HB1 FY 2005-06 Distribution to cities and towns, Ch. 95, 2004 Session Laws $40,250,000 FY 2005-06 Distribution to counties, Ch. 95, 2004 Session Laws $17,250,000 FY 2006 Distribution to cities and towns, Ch. 191, 2005 Session Laws $15,325,000 FY 2006 Distribution to counties, Ch. 191, 2005 Session Laws $11,975,000 FY 2006 Distribution to county road funds, Ch. 191, 2005 Session Laws $6,100,000 FY 2007-08 Distribution to cities and towns, Ch. 35, 2006 Session Laws $59,833,333 FY 2007-08 Distribution to counties, Ch. 35, 2006 Session Laws $33,166,667 FY 2007-08 Distribution to counties for libraries, Ch. 35 2006 Session Laws $2,900,000 FY 2007-08 food tax exemption hold-harmless, Ch. 35, 2006 Session Laws $46,600,000 FY 2008 Distribution to cities and towns, Ch. 136, 2007 Session Laws $15,910,333 FY 2008 Distribution to counties, Ch. 136, 2007 Session Laws $9,205,167 FY 2009-10 Direct Distributions to cities and towns, Ch. 48, 2008 Session Laws $86,913,334 FY 2009-10 Direct Distributions to counties, Ch. 48, 2008 Session Laws $42,086,666 FY 2009-10 food tax exemption hold harmless, Ch. 48, 2008 Session Laws $20,000,000 FY 2010 5% budget reduction in direct distribution to cities, towns and counties ($3,225,000) FY 2011-12 Direct Distributions to cities and towns (historical allocations) $56,701,003 FY 2011-12 Direct Distributions to counties (historical allocations) $30,755,557 Total Direct Distributions $90,900,000 $167,615,500 $145,775,000 $87,456,560 GF, BRA, and S4 Appropriations to SLIB Grant Program FY 2005-06 FY 2007-08 FY 2009-10 FY 2011-12 HB1 Appropriations from Local Government CapCon Account (S4) $35,000,000 $33,400,000 $33,400,000 $33,400,000 Local Govt. CapCon., Ch. 191, 2005 Session Laws $28,000,000 Local Govt. CapCon., Ch. 35, 2006 Session Laws $4,401,364 $138,399,318 Impact Mitigation - Capital Projects, Ch. 136, 2007 session laws $6,534,500 County Block Allocations - Capital Projects, Ch. 136, 2007 session laws $18,665,500 Emergency Reserve - Capital Projects, Ch. 136, 2007 session laws $934,500 FY 2009-10 County Block Distribution - Capital Projects, Ch. 48, '08 Session Laws $191,000,000 FY 2009-10 Emergency Capital Project Grants, Ch. 48, 2008 Session Laws $10,000,000 Matching Grant Funds for Wamsutter Infrastructure, Ch. 159, 2009 Session Laws $3,500,000 Emergency Capital Project Grants, Ch. 159, 2009 Session Laws $4,700,000 2011-12 Local Govt. CapCon from GF Total GF, BRA and S4 Appropriations to SLIB Grant Program $67,401,364 $197,933,818 $242,600,000 $33,400,000 Total Direct Distributions and SLIB Grant Appropriations $158,301,364 $365,549,318 $388,375,000 $120,856,560 GF Appropriations to Business Ready & Comm. Facilities Programs FY 2005-06 FY 2007-08 FY 2009-10 FY 2011-12 HB1 Business Ready Communities, Ch. 95, 2004 Session Laws $25,000,000 Business Ready Communities, Ch. 191, 2005 Session Laws $11,700,000 Community Facilities, Ch. 233, 2005 Session Laws $7,500,000 Business Ready Communities, Ch. 35, 2006 Session Laws $8,732,802 $37,267,198 Community Facilities, Ch. 35, 2006 Session Laws $15,000,000 Business Ready Communities, Ch. 136, 2007 session laws $33,250,000 FY 2009-10 Business Ready Communities - Ch.048 , 2008 Session Laws $79,250,000 FY 2009-10 Community Facilities - Ch. 48, 2008 Session Laws $15,000,000 FY 2010 Budget reduction to Business Ready Community grants ($4,000,000) FY 2010 Budget reduction to Community Facilities grants ($3,500,000) FY 2011-12 Business Ready Communities $50,000,000 FY 2011-12 Community Facilities $8,500,000 Total GF Appropriations to Bus. Ready & Comm Fac. Programs $52,932,802 $85,517,198 $86,750,000 $58,500,000 Total Direct Distributions and Grant Program Funding $211,234,166 $451,066,516 $475,125,000 $179,356,560
Slide #22 Source: LSO Budget/Fiscal Division
SLIDE 23
Severance Taxes Severance tax decrease to cities and towns from de-earmarking ($336,884,951) Severance tax decrease to counties from de-earmarking ($198,940,828) Severance tax decrease to State Aid County Roads from de-earmarking ($26,658,377) Severance tax decrease to CTC CapCon from de-earmarking ($14,573,422) Severance tax decrease to CTC CapCon, Ch. 163, 05 Session Laws ($5,500,578) total ($582,558,156) Federal Mineral Royalties (FMRs) FMR decrease to cities and towns from de-earmarking ($57,349,344) FMR decrease to CTC CapCon from de-earmarking ($44,939,473) total ($102,288,817) Fuel Tax Fuel tax increase to cities and towns from expiration of diversion to SFP $11,547,435 Fuel tax increase to counties from expiration of diversion to SFP $28,178,077 total $39,725,512 Sales and Use Taxes Sales and use tax increase to cities and towns, Ch. 79, 02 Session Laws $73,767,772 Sales and use tax increase to counties, Ch. 79, 02 Session Laws $94,276,233 Food Tax exemption estimate FY07-FY12 ($120,000,000) total $48,044,005 Direct Distributions Distribution of Municipal Rainy Day Account (MRDA) in Nov. 2001 $41,594,812 Decrease in distribution of interest earnings from MRDA ($114,407,549) Jobs & Growth Reconciliation Act of 2003 to cities and towns $2,885,214 Jobs & Growth Reconciliation Act of 2003 to counties $2,114,786 FY 2005-06 Distribution to cities and towns, Ch. 95, 04 Session Laws $40,250,000 FY 2005-06 Distribution to counties, Ch. 95, 04 Session Laws $17,250,000 FY 2006 Distribution to cities and towns, Ch. 191, 05 Session Laws $15,325,000 FY 2006 Distribution to counties, Ch. 191, 05 Session Laws $11,975,000 FY 2006 Distribution to county road funds, Ch. 191, 05 Session Laws $6,100,000 FY 2007-08 Distribution to cities and towns, Ch. 35, 06 Session Laws $59,833,333 FY 2007-08 Distribution to counties, Ch. 35, 06 Session Laws $33,166,667 FY 2007-08 Distribution to counties for libraries, Ch. 35 06 Session Laws $2,900,000 FY 2007-08 food tax exemption hold-harmless, Ch. 35, 06 Session Laws $46,600,000 FY 2008 Distribution to cities and towns, Ch. 136, 07 Session Laws $15,910,333 FY 2008 Distribution to counties, Ch. 136, 07 Session Laws $9,205,167 FY 2009-10 Distribution to cities and towns, Ch. 48, 08 Session Laws $86,913,334 FY 2009-10 Distribution to counties, Ch. 48, 08 Session Laws $42,086,666 FY 2009-10 food tax exemption hold-harmless, Ch. 48, 08 Session Laws $20,000,000 FY 2010 budget reduction to direct distributions ($3,225,000) FY 2011-12 direct distribution to cities, towns, and counties, 2010 HB 1 $87,456,560 total $423,934,323 Appropriations to Mineral Royalty Grant Program FY 2003-04 Mineral royalty grant funding approp., Ch. 83, 02 Session Laws $7,500,000 FY06 Mineral royalty grant funding approp., Ch. 191, 05 Session Laws $28,000,000 FY 2007-08 Mineral royalty grant funding approp., Ch. 35, 06 Session Laws $141,200,682 FY08 Mineral royalty grant funding approp., Ch. 136, 07 Session Laws $1,600,000 FY08 Impact Mitigation - Capital Projects, Ch. 136, 07 Session Laws $6,534,500 FY08 County Block Allocations - Capital Projects, Ch. 136, 07 Session Laws $18,665,500 FY08 Emergency Reserve - Capital Projects, Ch. 136, 07 Session Laws $934,500 FY 2009-10 County Block Dist.- Capital Projects, Ch. 48, 08 Session Laws $191,000,000 FY 2009-10 Emergency Capital Project Grants, Ch. 48, 08 Session Laws $10,000,000 FY10 Mineral royalty grant funding approps.Ch. 159, 09 Session Laws $8,200,000 total $413,635,182 Appropriations to Business Ready and Community Facilities Programs FY04 Bus. Ready Comm. approp., Ch. 211, 03 Session Laws $5,000,000 FY 2005-06 Bus. Ready Comm. approp., Ch. 95, 04 Session Laws $25,000,000 FY06 Bus. Ready Comm. approp., Ch. 191, 05 Session Laws (net of rev.) $6,700,000 FY06 Comm. Facilities approp., Ch. 233, 05 Session Laws $7,500,000 FY 2007-08 Bus. Ready Comm. approp., Ch. 35, 06 Session Laws $46,000,000 FY 2007-08 Comm. Facilities approp., Ch. 35, 06 Session Laws $15,000,000 FY 2008 Bus. Ready Comm. approp., Ch. 136, 07 Session Laws $33,250,000 FY 2009-10 Bus. Ready Comm. approp., Ch. 48, 08 Session Laws $79,250,000 FY 2009-10 Comm. Facilities approp., Ch. 48, 08 Session Laws $15,000,000 FY 2010 budget reduction to Business Ready Communities ($4,000,000) FY 2010 budget reduction to Community Facilities ($3,500,000) FY 2011-12 Bus. Ready Comm. approp., 2010 HB 1 $50,000,000 FY 2011-12 Comm. Facilities approp., 2010 HB 1 $8,500,000 total $283,700,000 Net Impact to Local Govts. - FY 2002-2012 $524,192,049
Impact of De-earmarking and Other Actions on Local Governments Fiscal Years 2002-2012, as of March 5, 2010 - January 2010 CREG Slide #23 Source: LSO Budget/Fiscal Division
SLIDE 24 Available Funding (FY-09) (08 Distribution) “Prior Balance” Payment $82,700,759 Future Collection Payment $0 FY09 FUNDING $82,700,759 (Less) DEQ Budget Request AML Program Appropriation ($30,000,000) FY09 DEQ TOTAL ($30,000,000) (Less) Projected Projects Carbon Sequestration Activities ($1,223,866) Carbon County R&B Coal to Liquid ($10,000,000) University of Wyoming Energy Resources ($17,420,565) University of Wyoming High Plains Gasification ($20,000,000) Clean Coal Research ($3,800,000) FY09 PROJECTS TOTAL ($52,444,431) FY09 BUDGET TOTAL ($82,444,431) FY09 AML BALANCE FORWARD $256,328 Available Funding (FY-10) Unallocated Remaining FY09 Funding (08 Distribution) $256,328 “Prior Balance” Payment $82,700,759 Future Collection Payment $18,082,309 FY10 FUNDING $101,039,396 (Less) DEQ Supplemental Budget Request AML Program Appropriation ($30,000,000) Air Quality Upper Green Replaced GF with AML for Equipment and Contractua ($946,813) Vehicles Replaced GF with AML for Vehicles ($86,800) AQ Assessment Replaced GF with AML ($548,724) AQ Management New Request ($3,600,000) Land Quality Inspectors Replaced GF with AML for Vehicles ($35,000) Solid Waste Inspectors Replaced GF with AML for Vehicles ($35,000) Recycling New Request ($100,000) Orphan Sites ($2,000,000) DEQ LAB Share ($10,000,000) FY10 DEQ TOTAL ($47,352,337) (Less) Projected Projects University of Wyoming High Plains Gasification ($30,000,000) Coal Task Force Matching Funds for Research ($10,613,047) Uranium Production Program (SER) ($1,600,000) CO2 Sequestration Research Exxon Mobile & Schumberger ($8,000,000) UW Reclamation Ecology Endowment (School of Agriculture) ($1,500,000) UW Reclamation Ecology (School of Agriculture) ($500,000) ID of Potential CO2 Storage Sites and EPA Sequestration Regs ($734,616) State Parks South Pass ($45,000) FY10 PROJECTS TOTAL ($52,992,663) FY10 BUDGET TOTAL ($100,345,000) FY10 AML BALANCE FORWARD $694,396 Available Funding (FY-11) ESTIMATED Unallocated Remaining FY10 Funding (09 Distribution) $694,396 “Prior Balance” Payment $82,700,759 Estimated Future Collection Payment $34,651,311 FY11 FUNDING $118,046,466 (Less) DEQ Budget Request AML Program Appropriation ($33,400,000) Air Quality Statewide Energy Impacts (2 Ongoing Positions) (2 years) ($398,883) O&M Ambient Air Monuiters (2 years) ($1,400,000) Soild & Hazardous Waste Management SHWD Orphan Sites ($2,201,117) FY11 DEQ TOTAL ($37,400,000) (Less) Projected Projects CO2 Sequestration Research ($45,000,000) WGS CO2 Sequestration ($638,101) Coal Task Force Matching Funds for Research ($14,000,000) NMR Spectrometer ($985,000) UW Reclamation & Restoration Center (WRRC) ($666,000) School of Energy Clean Coal ($17,400,000) FY11 PROJECTS TOTAL ($78,689,101) FY11 BUDGET TOTAL ($116,089,101) FY11 AML BALANCE REMAINING $1,957,365
Abandoned Mine Land Funding and Distributions Since 2008
Slide #24 Source: Department of Environmental Quality Source: Department of Environmental Quality
SLIDE 25
LONG-TERM GF/BRA/LSRA PROFILE Using January 2010 CREG and 10 MAR 2010 profile Assumes 10% increases over FY 2011/12 biennial spending levels for FY 2013/14 biennium Biennial Budget Fiscal Profiles 2009/10 2011/12 2013/14 LSRA beginning balance from June 30 of prior biennium 353,071,900 700,135,516 711,873,724
1
GF carryover 10,000,000
2
BRA carryover 773,168,389 96,355,000 93,025,000
3
Total carryover 783,168,389 96,355,000 93,025,000
4
GF PROJECTED Revenue 1,990,717,630 1,860,500,000 2,015,100,000
5
BRA PROJECTED Revenue 1,120,678,754 1,036,300,000 1,454,400,000
6
Reversions 71,928,187 N/A N/A
7
Total GF/BRA Revenues Available 3,183,324,571 2,896,800,000 3,469,500,000
8
2009/10 Total GF/BRA budget bill (3,663,493,057)
9
2009/10 Total GF/BRA budget session - Other Bills (61,377,287)
10
2009/10 GF/BRA budget reductions 206,184,214
11
2011/12 Total GF/BRA budget bill (2,554,000) (2,855,615,070)
12
2011/12 Total GF/BRA budget session - Other Bills (1,834,214) (32,776,722)
13
2013/14 Estimated GF/BRA budget (with 10% increase over 11/12) N/A N/A (3,182,058,007)
14
Total GF/BRA Appropriations (3,523,074,344) (2,888,391,792) (3,182,058,007)
15
Balance Available (3+7+14) 443,418,616 104,763,208 380,466,993
16
Statutory Reserve Amount (5% of GF Revenue) (96,355,000) (93,025,000) (100,755,000)
17
GF/BRA Available to Transfer into LSRA at end of biennium (15+16) 347,063,616 11,738,208 279,711,993
18
LSRA ending balance (LSRA beginning balance + 17) 700,135,516 711,873,724 991,585,717 Line Explanations
1 GF/BRA carryover is eliminated in the 2011/12 and 2013/14 biennia by Section 300 language which transfers to the LSRA all revenues in excess of appropriations and minimum statutory reserve amounts in BRA. 10 The reductions to the FY 2009/10 biennial appropriations shown on this line reflect the governor's 10% budget cuts made July 2009. 11,12 Appropriations shown for FY 2009/10 on these lines reflect effective immediate appropriations made in the 2010 budget session. 13 Estimated appropriations for the FY 2013/14 biennium reflect total appropriations for the FY 2011/12 biennium plus FY 2009/10 effective immediate appropriations inflated with a net 10% growth rate. 17 Transfer amounts shown on this line reflect latest estimates of funds available for transfer to the LSRA. FY 2013/14 biennial transfers assume continuation of transfer of available revenues into the LSRA at the end of the biennium
Slide #25 Source: LSO Budget/Fiscal Division