
SLIDE 1
Machine Learning for Trading Financial Investing
Technical Analysis
Fundamental Analysis
various (lots of factors) the drivers
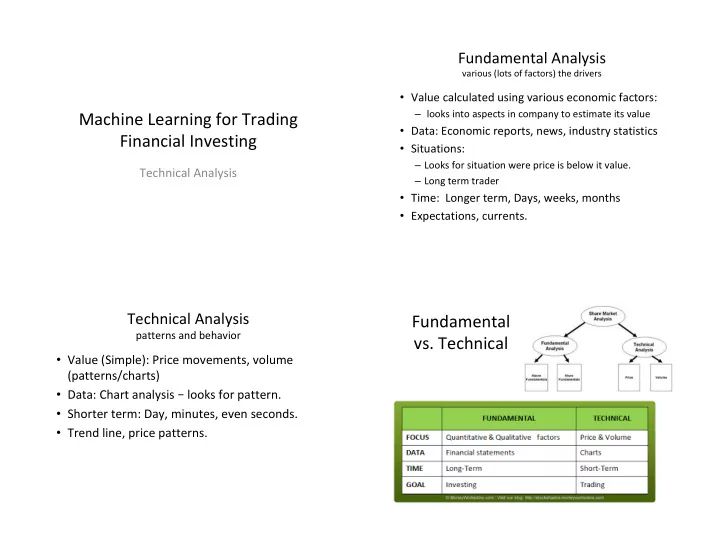
- Value calculated using various economic factors:
– looks into aspects in company to estimate its value
- Data: Economic reports, news, industry statistics
- Situations:
– Looks for situation were price is below it value. – Long term trader
- Time: Longer term, Days, weeks, months
- Expectations, currents.
Technical Analysis
patterns and behavior
- Value (Simple): Price movements, volume
(patterns/charts)
- Data: Chart analysis – looks for pattern.
- Shorter term: Day, minutes, even seconds.
- Trend line, price patterns.
Fundamental
- vs. Technical