Logistics At the top right corner of your screen: Show your control - - PowerPoint PPT Presentation

logistics
SMART_READER_LITE
LIVE PREVIEW

Logistics At the top right corner of your screen: Show your control - - PowerPoint PPT Presentation

Logistics At the top right corner of your screen: Show your control panel to submit questions and see answers All phones/microphones are muted for the duration of the webinar. Toggle between full screen/window screen view Control Panel:


slide-1
SLIDE 1

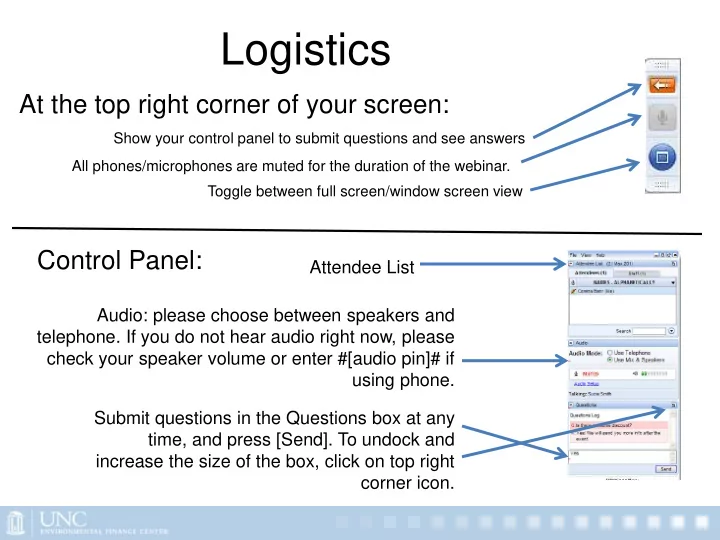
Show your control panel to submit questions and see answers Toggle between full screen/window screen view

At the top right corner of your screen: Control Panel:

Audio: please choose between speakers and

  • telephone. If you do not hear audio right now, please

check your speaker volume or enter #[audio pin]# if using phone. Submit questions in the Questions box at any time, and press [Send]. To undock and increase the size of the box, click on top right corner icon.

Logistics

All phones/microphones are muted for the duration of the webinar.

Attendee List

slide-2
SLIDE 2

http://efc.sog.unc.edu

Benchmarking Rates and Financial Health in Virginia

Sheryl Stephens Draper Aden Associates

www.daa.com

David Tucker UNC Environmental Finance Center

sog.efc.unc.edu

October 17, 2013 Webinar

slide-3
SLIDE 3

Established in 1972, Draper Aden Associates, Inc. is a leading Virginia-based consulting engineering firm with experience in facilities planning and engineering design for municipalities, government agencies, cultural institutions, and private

  • clients. We provide civil, environmental, geotechnical, solid waste, and structural

engineering; surveying and subsurface utility engineering; site planning and engineering; and construction inspection services throughout the Southeastern United States. Offices Located In Blacksburg, Richmond, Charlottesville and Newport News, Virginia

www.daa.com

slide-4
SLIDE 4

Dedicated to enhancing the ability of governments and

  • ther organizations to provide environmental programs

and services in fair, effective and financially sustainable ways.

How you pay for it matters!

efc.sog.unc.edu

slide-5
SLIDE 5

Smart Management for Small Water Systems

under a Cooperative Agreement with the US EPA

  • The EFCN provides training and technical assistance to small public

water systems in all fifty states and five territories to help local water systems achieve and maintain compliance with the Safe Drinking Water Act.

  • Workshops, trainings and direct assistance:

– Asset Management – Water Loss Reduction – Water System Collaboration – Fiscal Planning and Rate Setting – Energy Management – Funding Coordination, and – Managerial and Financial Leadership

  • Sign up for direct assistance at http://efcnetwork.org/one-on-one/
slide-6
SLIDE 6

Everyone needs safe drinking water!

slide-7
SLIDE 7

Objectives

  • become familiar with the features and

benefits of our Virginia water and wastewater rates dashboard

  • learn how to compare one water systems'

rates with those of other systems

  • learn how to apply several useful financial

benchmarks to your system(s).

slide-8
SLIDE 8

Geographic representation: All Registrants

slide-9
SLIDE 9

Poll Question 1

slide-10
SLIDE 10

Draper Aden’s 25th Annual Virginia Water and Wastewater Report

  • Mail survey to 268 utilities in Virginia
  • Include all municipally-owned water and

wastewater systems

  • 57% response rate
slide-11
SLIDE 11

Response Breakdown

Largest Smallest

(based on # of residential customers)

38 Authorities Fairfax Water Ferrum WSA 67 Towns Town of Leesburg Town of Glyn Lyn 24 Counties Chesterfield Co. Powhatan Co. 24 Cities City of VA Beach City of Norton

25% 16% 16% 44% Authorities Cities Counties Towns

slide-12
SLIDE 12

Control Group

  • 20 utilities in control group

– 7 Authorities – 2 Cities – 3 Counties – 8 Towns

  • Large and Small Utilities
  • Rural and Urban
  • From across Virginia
slide-13
SLIDE 13

$17.97 $18.25 $19.52 $19.94 $21.59 $22.50 $23.58 $25.00 $25.70 $27.25 $28.34 $19.96 $20.91 $22.01 $22.83 $25.32 $27.74 $29.56 $31.03 $32.88 $35.34 $37.00

$- $10.00 $20.00 $30.00 $40.00 $50.00 $60.00 $70.00 2003 2004 2005 2006 2007 2008 2009 2010 2011 2012 2013

Control Group Residential Water and Wastewater Charges - 5,000 gallons/month

Average Water Rate Average Wastewater Rate

2012 – 2013 4.0% increase – water rates 4.7% increase – sewer rates

slide-14
SLIDE 14

Water Rates (from all respondents)

Water Replies Average Median # Residential Connections 144 10,227 2,053 # Non-Residential Connections 142 775 198 Monthly Residential Charge - 5,000 gallons (Inside of Municipal Boundaries) 150 $30.98 $29.70 Monthly Residential Charge - 5,000 gallons (Outside of Municipal Boundaries) 65 $45.07 $40.03 Monthly Non-Residential Charge - 1,000,000 gallons (Inside of Municipal Boundaries) 126 $5,394 $4,907

slide-15
SLIDE 15

Average Residential Water Rates by System Size

$32.75 $46.09 $27.62 $42.81 $23.87

$- $5.00 $10.00 $15.00 $20.00 $25.00 $30.00 $35.00 $40.00 $45.00 $50.00

Inside Municipal Boundaries Outside Municipal Boundaries

< 5,000 Connections 5,000 - 50,000 Connections > 50,000 Connections

slide-16
SLIDE 16

Wastewater Rates (from all respondents)

Wastewater Replies Average Median # Residential Connections 136 10,870 1,652 # Non-Residential Connections 132 905 243 Monthly Residential Charge - 5,000 gallons (Inside of Municipal Boundaries) 142 $ 39.88 $ 38.50 Monthly Residential Charge - 5,000 gallons (Outside of Municipal Boundaries) 52 $ 61.33 $ 53.93 Monthly Non-Residential Charge - 1,000,000 gallons (Inside of Municipal Boundaries) 120 $ 6,731 $ 6,016

slide-17
SLIDE 17

Average Residential Wastewater Rates by System Size

$40.58 $63.09 $36.75 $51.73 $37.81

$- $10.00 $20.00 $30.00 $40.00 $50.00 $60.00 $70.00

Inside Municipal Boundaries Outside Municipal Boundaries

< 5,000 Connections 5,000 - 50,000 Connections > 50,000 Connections

slide-18
SLIDE 18

Connection Fees

“charges for tapping into the water main and running a line to the water meter or tapping into a sewer line and installing a service line to the property line”

Capital Recovery Charges

“charges for buying into the existing system or charges that recognize the cost of adding capacity to the system” Also called “facility fees”, “system development charges”, etc.

slide-19
SLIDE 19

Water – Connection and CRC Fees

$2,193 $2,427 $2,784 $2,284 $4,511 $4,038 $5,324 $4,375 $3,339 $4,730 $6,333 $3,823

$- $1,000 $2,000 $3,000 $4,000 $5,000 $6,000 $7,000

< 5.000 Connections 5,000 - 50,000 Connections > 50,000 Connections All Responses

Connection Fee Capital Recovery Charge Connection and CRC Combined

slide-20
SLIDE 20

Wastewater–Connection and CRC Fees

$3,185 $2,607 $4,988 $3,161 $5,733 $5,693 $3,881 $5,583 $4,766 $5,900 $6,493 $5,131

$- $1,000 $2,000 $3,000 $4,000 $5,000 $6,000 $7,000

< 5.000 Connections 5,000 - 50,000 Connections > 50,000 Connections All Responses

Connection Fee Capital Recovery Charge Connection and CRC Combined

slide-21
SLIDE 21

Residential Demands

What is the average monthly water consumption of your residential customers?

13% 24% 34% 18% 5% 5%

More than 5,000 gallons Approximately 5,000 gallons Approximately 4,000 gallons Approcimately 3,000 gallons Less than 3,000 gallons Don't Know

slide-22
SLIDE 22

Residential Demands

How has the average residential consumption changed over the past 10 years?

13% 38% 34% 15%

Increased Decreased Stayed the Same Don't Know

slide-23
SLIDE 23

Residential Demands

Do you think declining demands are a temporary pattern or the new normal?

7% 89% 4%

Temporary New Normal Don't Know

slide-24
SLIDE 24

Residential Demands

0% 10% 20% 30% 40% 50% 60% 70% 80% Installation of Low-Flow Fixtures/More Efficient Appliances Customers are Cost-Conscious Economic Downturn Concerned Customers are Conserving Resource Customers have Changed Outdoor Water Use Patterns Utility has Encouraged Customers to Reduce Water Use Rainwater Harvesting Don't Know Other

If average residential consumption has decreased, which of the following contributed to the decrease?

slide-25
SLIDE 25

Benchmarking Rates

slide-26
SLIDE 26

Rates in Virginia

Check out our Virginia Rates Dashboard

  • On the Draper Aden Website:
  • http://www.daa.com/publications/dashboard/
  • On the EFC Website
  • Go to

http://efc.sog.unc.edu and search for “Virginia Water and Wastewater Rates Dashboard”

slide-27
SLIDE 27

Source of pride

slide-28
SLIDE 28

Comparing rates – the old way

Source: NC Triangle J Council of Government

slide-29
SLIDE 29

What’s wrong with it?

  • Poor sample selection (number, types of

systems)

  • Comparing only one bill amount
  • Comparing nothing besides rates

– pressure to keep rates low … – … regardless of financial condition of utility – ignores customers’ ability to pay – ignores price signals and utility’s policies

slide-30
SLIDE 30

Solution: provide more information?

185 pages

  • f wonderful tables,

full of data you can use!

slide-31
SLIDE 31

Demonstrate the Dashboards http://efc.sog.unc.edu

slide-32
SLIDE 32

Rates Dashboards

  • Created for VA, CO, GA, NC, NJ, and TX.
  • AZ coming soon!
  • Free, online, open to the public
  • Compares rates against multiple

characteristics:

Utility finances; System characteristics; Customer base socioeconomic conditions; Geography; History

  • Compare to similar utilities (large samples):

– All utilities; same size (accounts); same ownership type; same river basin; same customer income levels; within 50 miles; same planning districts

slide-33
SLIDE 33

Some EFCN Resources

Tools, trainings, assistance and resources for small water systems: www.efcnetwork.org

slide-34
SLIDE 34

Poll Questions 2, 3 and 4; and Qualtrics survey link

slide-35
SLIDE 35

http://efc.sog.unc.edu

Thank you!

David Tucker EFC at University of North Carolina, Chapel Hill 919-966-4199 drtucker@sog.unc.edu Sheryl Stephens Draper Aden Associates 804-261-2915 sstephens@daa.com Lexi Kay EFC at University of North Carolina, Chapel Hill 919-843-3528 akay@sog.unc.edu Cathy Hanks Draper Aden Associates 540-552-0444 chanks@daa.com