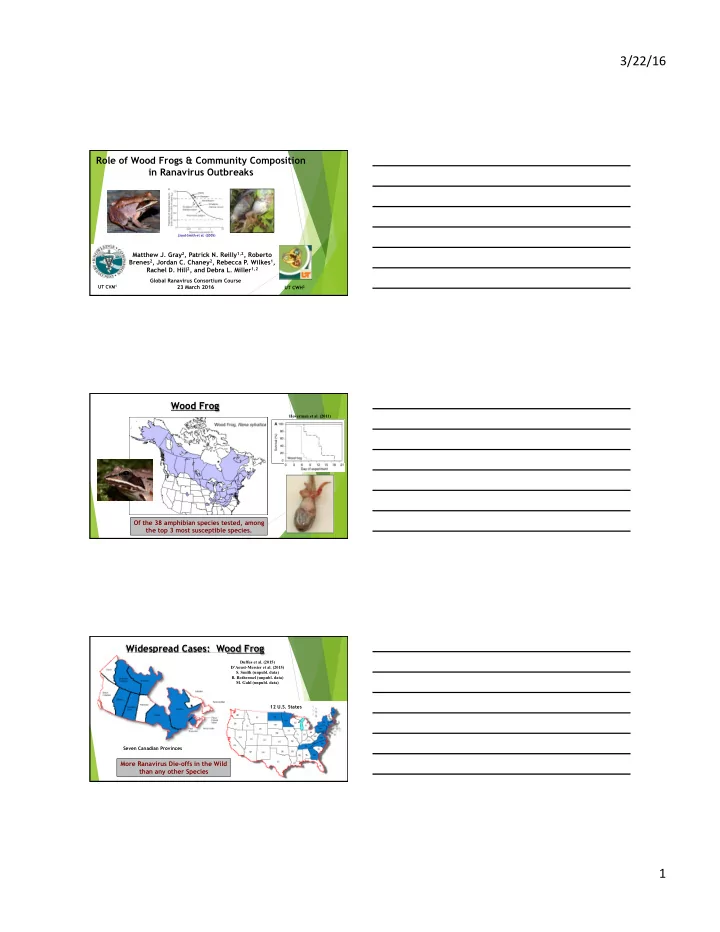
Lloyd-Smith et al. (2005) Matthew J. Gray 2 , Patrick N. Reilly 1,2 , - - PDF document

lloyd smith et al 2005 matthew j gray 2 patrick n reilly
SMART_READER_LITE
LIVE PREVIEW

Lloyd-Smith et al. (2005) Matthew J. Gray 2 , Patrick N. Reilly 1,2 , - - PDF document

3/22/16 Role of Wood Frogs & Community Composition in Ranavirus Outbreaks Lloyd-Smith et al. (2005) Matthew J. Gray 2 , Patrick N. Reilly 1,2 , Roberto Brenes 2 , Jordan C. Chaney 2 , Rebecca P. Wilkes 1 , Rachel D. Hill 2 , and Debra L.


slide-1
SLIDE 1

3/22/16 ¡ 1 ¡

Matthew J. Gray2, Patrick N. Reilly1,2, Roberto Brenes2, Jordan C. Chaney2, Rebecca P. Wilkes1, Rachel D. Hill2, and Debra L. Miller1,2

Role of Wood Frogs & Community Composition in Ranavirus Outbreaks

Global Ranavirus Consortium Course 23 March 2016

Lloyd-Smith et al. (2005)

UT CVM1 UT CWH2

Wood Frog

Hoverman et al. (2011)

Of the 38 amphibian species tested, among the top 3 most susceptible species.

Widespread Cases: Wood Frog

Seven Canadian Provinces 12 U.S. States Duffus et al. (2015) D’Aoust-Messier et al. (2015)

  • S. Smith (unpubl. data)
  • B. Rothermel (unpubl. data)
  • M. Gahl (unpubl. data)

More Ranavirus Die-offs in the Wild than any other Species

slide-2
SLIDE 2

3/22/16 ¡ 2 ¡

Classical Cases: Wood Frogs

>200,000 Tadpoles In 24 hours Wheelwright et al. (2014): ME Green et al. (2002), Todd-Thompson (2010): TN Hoverman et al. (2011) Community-level Effects?

Grim Reaper: Amplifying Species

Frontiers in Ecology and the Environment 10:75-82 2012 Superspreading Individuals Amplification Species

Disease Hotspots

Susceptibility Contact Rate Shedding Rate Contact Host Community Contact Rate Persistence Dispersal

  • Green et al. (2002)
  • Petranka et al.

(2003)

  • Harp and

Petranka (2006)

  • Gahl and

Calhoun (2010)

  • Uyeharaet al.

(2010)

  • Brunner et al.

(2011)

Ranavirus 95-100%

Lloyd-Smith et al. (2005)

u Test whether superspreading occurs for two common amphibian host

species (wood frog and Cope’s gray treefrog)

u Test for differences in viral shedding and contact rate between host

species: which contributes more to initiate outbreaks?

u Test whether infected wood frog tadpoles co-housed with uninfected

Cope’s gray treefrog tadpoles results in amplified infection & mortality

OBJECTIVES

slide-3
SLIDE 3

3/22/16 ¡ 3 ¡

Methods:

Highly Susceptible Species

  • Wood frog (Lithobates sylvaticus)

Moderately Susceptible Species

  • Cope’s gray treefrog (Hyla

chrysoscelis)

FV3-like Ranavirus

  • American bullfrog (GA)

Wood frog tadpole Cope’s gray treefrog tadpole

Standardized: Gosner 30 35-70% Mortality 95-100% Mortality

Hoverman et al. (2011) Miller et al. (2007) Haislip et al. (2011)

EXPERIMENTAL DESIGN

Inoculation

  • 20 individuals
  • 1 liter of water
  • 3 day exposure
  • 103PFU/ml

Hoverman et al. (2010)

6-Hour Co-habitation

  • One exposed individual introduced

to 10 unexposed individuals (LOW)

  • N = 20 1224-cm2 (12 qt) tubs with

5.5 liters of water Robert et al. (2011)

20 exposed, 200 unexposed individuals

Individual Monitoring

  • 20 exposed were euthanized

tested for infection using qPCR

  • Others separated into 2-L tubs

with 1-L of water.

  • Monitored for 14 days

Individuals from the same tub, RCB design

Results: Wood frog

Percent Mortality:

Day 5 Day 10 Day 14

% Infection Transmission in All Tubs 17/20 = 85% Superspreading Occurred 20-80 Rule: <20% of Individuals Result in >80% of Transmission

slide-4
SLIDE 4

3/22/16 ¡ 4 ¡

Results: Cope’s gray treefrog

% Infection

  • Transmission in 15% of tubs but no superspreading
  • No mortality due to ranavirus infection

Differences in Host Susceptibility (Initially Exposed: 72 + 6 hrs)

Mean Viral Load was 43% greater in Wood Frog Tissue Shedding Contact

?

Contact Rates

Infected wood frog tadpoles moved more but number of contacts did not differ with Cope’s gray treefrog tadpoles.

15 Minute Observations Mean = 0.8 – 0.9 contacts/min Uniform Contact = 9 Minutes: 30X (co-housed 6 hours) Low Density = 44 tadpoles/m2 A B a a

slide-5
SLIDE 5

3/22/16 ¡ 5 ¡

Shedding Rates

Wood frog tadpoles shed more virus than Cope’s gray treefrog tadpoles.

0.4 0.8 1.2 1.6

24 48 72

10^X ug/ul (per .25ug DNA)

Post-Exposure Time (hrs) eDNA Viral Load HYCH RASY

A B

100.4 PFU/mL 100.45 PFU/mL 100.85 PFU/mL 101.3 PFU/mL

Exposed 72 hours: Water Changed No Virus Detected for 48 hours (Day 5 PE) 100.45 PFU/mL per 24 hours Second Experiment Water Collected thereafter: 1, 3, 6, 12, 24, 48, 72 hrs Wood Frogs

How Long to Reach Lethal Dose? LD50 = 102.4 PFU/mL

100.45 PFU/mL per 24 hours

Reach LD50 in 8.3 days and LD100 in 10.5 days Contact Most Important Initially, with Shedding Playing a Role Later

(assumes minimal virion degradation & no shedding from dead tadpoles) Warne et al. (2011)

Cross-Species Transmission Experiments

Transmission to Gray Treefrogs from Wood Frog Tadpoles

0% 10% 20% 30% 40% 50% 60% 70% 80% 90% 100% 1 2 3 4 5 6 7 8 9 10 11 12 13 14 15 16 17 18 19 20 Died+Not Inf Sur+ Not Inf Sur+Inf Died+Inf

70% of Wood Frogs that were initially exposed were infected after 3 days when co-habitation occurred Transmission in 35% of tubs. More than gray treefrog tadpole transmission amongst each

  • ther (15%).

1/20 = 5% Superspreading Occurred. No Amplification

  • f Mortality.

Co-housed for only 6 hours; no necrophagy

slide-6
SLIDE 6

3/22/16 ¡ 6 ¡

Cross-Species Transmission Experiments

0% 10% 20% 30% 40% 50% 60% 70% 80% 90% 100% 1 2 3 4 5 6 7 8 9 10 11 12 13 14 15 16 17 18 19 20 Died+Not Inf Sur+ Not Inf Sur+Inf Died+Inf

Transmission to Wood Frogs from Gray Treefrog Tadpoles 25% of Gray Treefrogs that were initially exposed were infected after 3 days when co-habitation occurred Superspreading Did Not Occur One Transmission Event Documented

Thus, ranavirus outbreaks probably

  • riginate from within-species transmission

events associated with highly susceptible species.

SUMMARY

u Probability of ranavirus transmission differs among

species.

u Wood frog tadpoles are superspreaders of ranavirus but

amplification may depend on other host species (highly susceptible) present.

u Limitations: Co-housed for 6 hours, Necrophagy not

included.

u Contact of individuals probably initiates an outbreak,

but shedding may be more important later and result in high environmental concentrations that result in rapid transmission and mortality of less susceptible species.

Community Level Transmission

Brenes, Gray, Hoverman & Miller (unpubl. data)

Does Exposure Order or Composition Matter?

Inoculated in Lab 103 PFU/mL FV3 Exposure Order Appalachian: Wood frog, chorus frog, spotted salamander Coastal Plains: Gopher frog, chorus, southern toad

Objective #2: Mesocosm Experiment

slide-7
SLIDE 7

3/22/16 ¡ 7 ¡

Exposure Order Matters

Brenes (2013)

Only Wood Frogs Only Chorus Frogs Only Spotted Salamanders Control n = 5 pools/trt 10 larvae/spp 60 days co-habitation All transmission routes possible Exposure Treatments Design Wood Frogs 100% 43% 12% Chorus Frogs Spotted Salam 72% 3% Wood Frogs Spotted Salam 24% 18% Chorus Frogs Wood Frogs Chorus Frogs 44% Spotted Salam 6%

52% 16% 40%

Appalachian Community (high) (mod) (low)

Objective #2: Mesocosm Experiment

Community Composition Matters

Brenes (2013)

Only Gopher Frogs Only Chorus Frogs Only Southern Toad Control n = 5 pools/trt 10 larvae/spp 60 days Exposure Treatments Design Gopher Frogs 100% 52% 34% Chorus Frogs Southern Toad 70% 58% Gopher Frog Southern Toad 32% 80% Chorus Frogs Gopher Frog Chorus Frogs 78% Southern Toad 76%

62% 62% 68%

Gulf Coastal Plain, USA (high) (high) (high)

Objective #2: Mesocosm Experiment

SUMMARY

u Our results suggest that the probability of ranavirus

transmission differs among species.

u Species exposure order affects ranavirus outbreak

  • utcomes, perhaps due to differences in virus shedding.

u Probability of an outbreak increases with the number of

highly susceptible species in a community.

slide-8
SLIDE 8

3/22/16 ¡ 8 ¡

What Causes an Outbreak?

  • Contact Rates
  • Shedding
  • Necrophagy
  • Environmental Persistence
  • Density (100/m2)
  • Community Composition
  • A. Peace
  • S. O’Regan

Reservoirs or Amplification Hosts?

FV3-like Ranaviruses

Low Mortality (Subclinical) Low Mortality (Subclinical) Low – High Mortality (Subclinical & Clinical) Reservoir Reservoir or Amplification Reservoir Suitable ¡Hosts ¡ Brunner et al. (2015) Gray et al. (2009)

Questions??

mgray11@utk.edu preilly2@utk.edu rbrenes@carrollu.edu dmille42@utk.edu