
SLIDE 1
LLOYD INTEGRATED INFRASTRUCTURE STRATEGY – PRELIMINARY FINDINGS
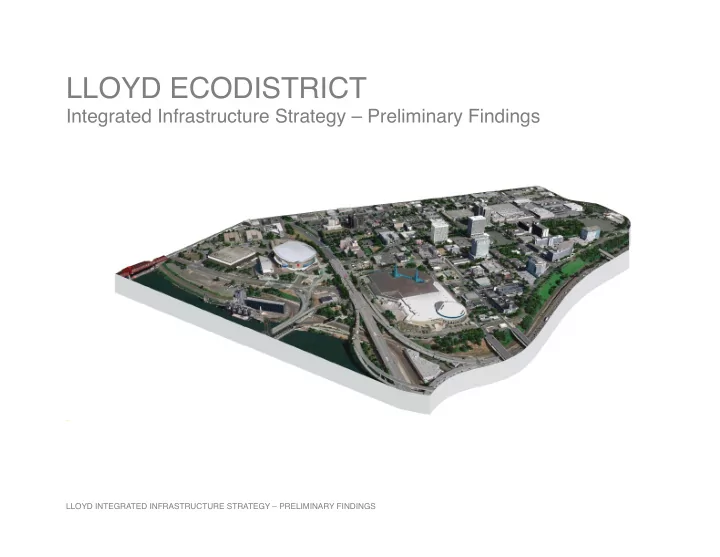
LLOYD ECODISTRICT Integrated Infrastructure Strategy Preliminary - - PowerPoint PPT Presentation
LLOYD ECODISTRICT Integrated Infrastructure Strategy Preliminary Findings LLOYD INTEGRATED INFRASTRUCTURE STRATEGY PRELIMINARY FINDINGS Strategy Objectives 1. Impact Assessment Assess district carbon,
LLOYD INTEGRATED INFRASTRUCTURE STRATEGY – PRELIMINARY FINDINGS
LLOYD INTEGRATED INFRASTRUCTURE STRATEGY – PRELIMINARY FINDINGS
May ¡Board ¡Mtg ¡ June ¡Review ¡ June ¡– ¡July ¡Develop ¡ July ¡Board ¡Mtg ¡ July ¡– ¡Aug ¡Finalize ¡ Sept ¡Board ¡Mtg ¡
LLOYD INTEGRATED INFRASTRUCTURE STRATEGY – PRELIMINARY FINDINGS
Strategies ¡
(programs ¡& ¡projects) ¡
Investment ¡Plan ¡ Implementa4on ¡ Roadmap ¡ Vision ¡
(“big ¡ideas”) ¡
(2010)
(2015, 2030, 2060)
(top down goals)
(bottom up goals)
LLOYD INTEGRATED INFRASTRUCTURE STRATEGY – PRELIMINARY FINDINGS
LLOYD INTEGRATED INFRASTRUCTURE STRATEGY – PRELIMINARY FINDINGS
LLOYD INTEGRATED INFRASTRUCTURE STRATEGY – PRELIMINARY FINDINGS
LLOYD INTEGRATED INFRASTRUCTURE STRATEGY – PRELIMINARY FINDINGS
0 ¡ 5,000,000 ¡ 10,000,000 ¡ 15,000,000 ¡ 2010 ¡ 2020 ¡ 2030 ¡ 2040 ¡ 2050 ¡ 2060 ¡
Building ¡Area ¡
Exis4ng ¡
Land ¡Use ¡Distribu4on ¡ (2010) ¡
Com ¡ Res ¡ Ind ¡
LLOYD INTEGRATED INFRASTRUCTURE STRATEGY – PRELIMINARY FINDINGS
0 ¡ 10,000,000 ¡ 20,000,000 ¡ 30,000,000 ¡ 40,000,000 ¡ 50,000,000 ¡ 2010 ¡ 2020 ¡ 2030 ¡ 2040 ¡ 2050 ¡ 2060 ¡
Building ¡Area ¡
New ¡ Exis4ng ¡
Land ¡Use ¡Distribu4on ¡ (2030) ¡
Com ¡ Res ¡ Ind ¡
Land ¡Use ¡Distribu4on ¡ (2010) ¡
Com ¡ Res ¡ Ind ¡
LLOYD INTEGRATED INFRASTRUCTURE STRATEGY – PRELIMINARY FINDINGS
Land ¡Use ¡Distribu4on ¡ (2030) ¡
Com ¡ Res ¡ Ind ¡
Land ¡Use ¡Distribu4on ¡ (2010) ¡
Com ¡ Res ¡ Ind ¡ 0 ¡ 10,000,000 ¡ 20,000,000 ¡ 30,000,000 ¡ 40,000,000 ¡ 50,000,000 ¡ 2010 ¡ 2020 ¡ 2030 ¡ 2040 ¡ 2050 ¡ 2060 ¡
Building ¡Area ¡by ¡Land ¡Use ¡
New ¡Res ¡ New ¡Com ¡ Exis4ng ¡Ind ¡ Exis4ng ¡Res ¡ Exis4ng ¡Com ¡
LLOYD INTEGRATED INFRASTRUCTURE STRATEGY – PRELIMINARY FINDINGS
LLOYD INTEGRATED INFRASTRUCTURE STRATEGY – PRELIMINARY FINDINGS
LLOYD ¡ DISTRICT ¡
BIOPHILIC ¡ DISTRICT ¡ EFFICIENT ¡ DISTRICT ¡
CONNECTED ¡ DISTRICT ¡
energy ¡ water ¡ waste ¡ green ¡ sites ¡
space ¡ streets ¡ transit ¡ share ¡ green ¡ streets ¡
LLOYD INTEGRATED INFRASTRUCTURE STRATEGY – PRELIMINARY FINDINGS
LLOYD ¡ DISTRICT ¡
BIOPHILIC ¡ DISTRICT ¡ EFFICIENT ¡ DISTRICT ¡
CONNECTED ¡ DISTRICT ¡
energy ¡ water ¡ waste ¡ green ¡ sites ¡
space ¡ streets ¡ transit ¡ share ¡ green ¡ streets ¡
LLOYD INTEGRATED INFRASTRUCTURE STRATEGY – PRELIMINARY FINDINGS
Vision ¡
(“big ¡ideas”) ¡
1. Exis4ng ¡Buildings ¡– ¡25% ¡reduc4on ¡in ¡energy ¡demand ¡by ¡2035. ¡ 2. New ¡Buildings ¡– ¡Net-‑zero ¡GHG ¡emissions ¡by ¡2035. ¡ ¡50% ¡reduc4on ¡in ¡energy ¡demand ¡by ¡2030.* ¡ 3. Renewable ¡Energy ¡(on-‑site) ¡& ¡District ¡Energy ¡– ¡10% ¡of ¡total ¡energy ¡demand ¡by ¡2035. ¡ 4. Renewable ¡Energy ¡(off-‑site) ¡– ¡20% ¡of ¡total ¡energy ¡demand ¡by ¡2035.* ¡
Energy ¡Reduc4on ¡
Water ¡Reduc4on ¡
Waste ¡Reduc4on ¡
Policy ¡Goal ¡ Exis4ng ¡Policies ¡and ¡Policy* ¡Recommenda4ons ¡ Efficient ¡District ¡
Site ¡EIA ¡
Street ¡EIA ¡
100m ¡to ¡Nature ¡
Biophlic ¡District ¡
1. Potable ¡Water ¡– ¡No ¡increase ¡in ¡City-‑provided ¡potable ¡water.* ¡ 1. Waste ¡Reduc4on ¡– ¡25% ¡waste ¡reduc4on ¡by ¡2035. ¡ 2. Waste ¡Recovery ¡– ¡90% ¡waste ¡recovery ¡by ¡2035. ¡ 1. Stormwater ¡Management ¡– ¡80% ¡effec4ve ¡impervious ¡area ¡(EIA) ¡for ¡all ¡proper4es.* ¡ 1. Stormwater ¡Management ¡– ¡40% ¡effec4ve ¡impervious ¡area ¡(EIA) ¡for ¡all ¡streets.* ¡ 1. Human/Nature ¡Interac4on ¡– ¡100% ¡of ¡popula4on ¡within ¡100M ¡of ¡a ¡connected, ¡integrated ¡ ecological ¡network ¡(ie, ¡park, ¡openspace, ¡green ¡street ¡corridor)* ¡
* ¡Connected ¡District ¡= ¡N/NE ¡Quad ¡Plan ¡
LLOYD INTEGRATED INFRASTRUCTURE STRATEGY – PRELIMINARY FINDINGS
0 ¡ 1,000,000 ¡ 2,000,000 ¡ 3,000,000 ¡ 4,000,000 ¡ 2010 ¡ 2020 ¡ 2030 ¡ 2040 ¡ 2050 ¡ 2060 ¡
Building ¡Energy ¡Demand ¡
Exist ¡ New ¡
Energy ¡Demand ¡by ¡Land ¡Use ¡ (2010) ¡
Com ¡ Res ¡ Ind ¡
Energy ¡Demand ¡by ¡Land ¡Use ¡ (2030) ¡
Com ¡ Res ¡ Ind ¡
LLOYD INTEGRATED INFRASTRUCTURE STRATEGY – PRELIMINARY FINDINGS
0 ¡ 500,000 ¡ 1,000,000 ¡ 1,500,000 ¡ 2,000,000 ¡ 2,500,000 ¡ 3,000,000 ¡ 3,500,000 ¡ 4,000,000 ¡ 2010 ¡ 2020 ¡ 2030 ¡ 2040 ¡ 2050 ¡ 2060 ¡
Building ¡Energy ¡Demand ¡
Reduce ¡exis4ng ¡building ¡demand ¡ By ¡25% ¡by ¡2030. ¡ Net-‑zero ¡GHG ¡emissions ¡for ¡all ¡new ¡ buildings ¡by ¡2030. ¡
10% ¡of ¡energy ¡demand ¡met ¡by ¡on-‑site ¡ renewable ¡energy ¡and ¡district ¡energy ¡by ¡2030. ¡
0 ¡ 200,000 ¡ 400,000 ¡ 600,000 ¡ 800,000 ¡ 1,000,000 ¡ 1,200,000 ¡ Com ¡ Res ¡ Ind ¡
Exis4ng ¡and ¡New ¡Energy ¡Demand ¡(2030) ¡
Exist ¡ New ¡
Renewable ¡Energy ¡(RE) ¡ District ¡Energy ¡(DE) ¡ Commercial ¡EE ¡Retrofits ¡ New ¡Building ¡EE ¡
LLOYD INTEGRATED INFRASTRUCTURE STRATEGY – PRELIMINARY FINDINGS
0 ¡ 500,000 ¡ 1,000,000 ¡ 1,500,000 ¡ 2,000,000 ¡ 2,500,000 ¡ 3,000,000 ¡ 3,500,000 ¡ 4,000,000 ¡ 2010 ¡ 2020 ¡ 2030 ¡ 2040 ¡ 2050 ¡ 2060 ¡
Building ¡Energy ¡Demand ¡
Reduce ¡exis4ng ¡building ¡demand ¡ By ¡25% ¡by ¡2030. ¡ Net-‑zero ¡GHG ¡emissions ¡for ¡all ¡new ¡ buildings ¡by ¡2030. ¡
10% ¡of ¡energy ¡demand ¡met ¡by ¡on-‑site ¡ renewable ¡energy ¡and ¡district ¡energy ¡by ¡2030. ¡
LLOYD INTEGRATED INFRASTRUCTURE STRATEGY – PRELIMINARY FINDINGS
LLOYD INTEGRATED INFRASTRUCTURE STRATEGY – PRELIMINARY FINDINGS
Water ¡Demand ¡by ¡Land ¡Use ¡ (2030) ¡
Com ¡ Res ¡ Ind ¡
Water ¡Demand ¡by ¡Land ¡Use ¡ (2010) ¡
Com ¡ Res ¡ Ind ¡ 0 ¡ 200,000,000 ¡ 400,000,000 ¡ 600,000,000 ¡ 800,000,000 ¡ 1,000,000,000 ¡ 2010 ¡ 2020 ¡ 2030 ¡ 2040 ¡ 2050 ¡ 2060 ¡
Water ¡Demand ¡
new ¡ exis4ng ¡
LLOYD INTEGRATED INFRASTRUCTURE STRATEGY – PRELIMINARY FINDINGS
0 ¡ 50,000,000 ¡ 100,000,000 ¡ 150,000,000 ¡ 200,000,000 ¡ Com ¡ Res ¡ Ind ¡
Exis4ng ¡and ¡New ¡Water ¡Demand ¡
Exis4ng ¡ New ¡ 0 ¡ 100,000,000 ¡ 200,000,000 ¡ 300,000,000 ¡ 400,000,000 ¡ 500,000,000 ¡ 600,000,000 ¡ 700,000,000 ¡ 800,000,000 ¡ 900,000,000 ¡ 2010 ¡ 2020 ¡ 2030 ¡ 2040 ¡ 2050 ¡ 2060 ¡
No ¡increase ¡in ¡City-‑provided ¡potable ¡water. ¡
Commercial ¡WE ¡Retrofits ¡ New ¡Building ¡WE ¡ Superblock ¡Water ¡Reuse ¡ Sub-‑District ¡Water ¡Reuse ¡
LLOYD INTEGRATED INFRASTRUCTURE STRATEGY – PRELIMINARY FINDINGS
0 ¡ 100,000,000 ¡ 200,000,000 ¡ 300,000,000 ¡ 400,000,000 ¡ 500,000,000 ¡ 600,000,000 ¡ 700,000,000 ¡ 800,000,000 ¡ 900,000,000 ¡ 2010 ¡ 2020 ¡ 2030 ¡ 2040 ¡ 2050 ¡ 2060 ¡
No ¡increase ¡in ¡City-‑provided ¡potable ¡water. ¡
LLOYD INTEGRATED INFRASTRUCTURE STRATEGY – PRELIMINARY FINDINGS
LLOYD INTEGRATED INFRASTRUCTURE STRATEGY – PRELIMINARY FINDINGS
0 ¡ 50,000 ¡ 100,000 ¡ 150,000 ¡ 200,000 ¡ 250,000 ¡ 2010 ¡ 2020 ¡ 2030 ¡ 2040 ¡ 2050 ¡ 2060 ¡
Waste ¡Genera4on ¡
New ¡ Exis4ng ¡
Waste ¡by ¡Land ¡Use ¡(2010) ¡
Com ¡ Res ¡ Ind ¡
Waste ¡by ¡Land ¡Use ¡(2030) ¡
Com ¡ Res ¡ Ind ¡
LLOYD INTEGRATED INFRASTRUCTURE STRATEGY – PRELIMINARY FINDINGS
0 ¡ 50,000 ¡ 100,000 ¡ 150,000 ¡ 200,000 ¡ 250,000 ¡ 2010 ¡ 2020 ¡ 2030 ¡ 2040 ¡ 2050 ¡ 2060 ¡
Reduce ¡waste ¡genera4on ¡by ¡25% ¡by ¡2030 ¡& ¡ Recover ¡90% ¡of ¡waste ¡generated. ¡
0% ¡ 20% ¡ 40% ¡ 60% ¡ 80% ¡ 100% ¡ 2010 ¡ 2020 ¡ 2030 ¡ 2040 ¡ 2050 ¡ 2060 ¡
LLOYD INTEGRATED INFRASTRUCTURE STRATEGY – PRELIMINARY FINDINGS
LLOYD INTEGRATED INFRASTRUCTURE STRATEGY – PRELIMINARY FINDINGS
EIA ¡& ¡Green ¡Factor, ¡Corridors ¡& ¡Nodes, ¡ ¡ Human-‑Nature ¡Connec4on ¡and ¡Interac4on ¡(in ¡progress) ¡
LLOYD INTEGRATED INFRASTRUCTURE STRATEGY – PRELIMINARY FINDINGS
LLOYD INTEGRATED INFRASTRUCTURE STRATEGY – PRELIMINARY FINDINGS
Vision ¡
(“big ¡ideas”) ¡
1. Exis4ng ¡Building ¡Energy ¡Conserva4on ¡Retrofit ¡Program ¡(20-‑35%) ¡ 2. New ¡Building ¡Energy ¡Conserva4on ¡Program ¡(20-‑50%) ¡ 3. Energy ¡Efficient ¡Street ¡Lights ¡(1%) ¡ 4. Renewables ¡(3-‑5%) ¡ 5. District ¡Energy ¡(30-‑50%) ¡
Energy ¡Reduc4on ¡
Energy ¡Reduc4on ¡
Energy ¡Reduc4on ¡
Water ¡Reduc4on ¡
Water ¡Reduc4on ¡
Water ¡Reduc4on ¡
Waste ¡Reduc4on ¡
Waste ¡Reduc4on ¡
Waste ¡Reduc4on ¡
Policy ¡Goal ¡ Reality ¡Goal ¡ Recommended ¡Strategies ¡ Recommended ¡ ¡ Goal ¡ Efficient ¡District ¡
Site ¡EIA ¡
Site ¡EIA ¡
Site ¡EIA ¡
Street ¡EIA ¡
Street ¡EIA ¡
Street ¡EIA ¡
100M ¡to ¡Nature ¡
100m ¡to ¡Nature ¡
100M ¡to ¡Nature ¡
Biophlic ¡District ¡
1. Exis4ng ¡Building ¡Water ¡Conserva4on ¡and ¡Reuse ¡Retrofit ¡Program ¡ 2. New ¡Building ¡Water ¡Conserva4on ¡and ¡Reuse ¡Program ¡(performance ¡mandate?) ¡ 3. Superblock ¡Water ¡Reuse ¡Systems ¡(rainwater ¡harves4ng ¡and ¡wastewater ¡reuse) ¡ 4. Sub-‑District ¡Water ¡Reuse ¡Systems ¡(Rose ¡Quarter ¡and ¡“Lloyd ¡Park”) ¡ 5. Educa4on ¡– ¡Water ¡educa4on ¡and ¡challenge ¡(including ¡district ¡dashboard) ¡ 1. Greenstreet ¡Corridors ¡(Holladay, ¡Clackamas, ¡2nd, ¡6th, ¡Lloyd ¡Blvd) ¡ 2. Stormwater ¡“Parks” ¡(I-‑5, ¡Sullivan’s ¡Gulch, ¡Willameme ¡River) ¡ 3. Rose ¡Quarter ¡Green ¡Infrastructure ¡(separated ¡sewer ¡system) ¡ 4. “Lloyd ¡Park” ¡on ¡Clackamas ¡ 5. Superblock ¡Pocket ¡Parks ¡ 6. Educa4on ¡– ¡Healthy ¡Watershed/Healthy ¡People ¡Program ¡(incl. ¡district ¡dashboard) ¡ 1. Greenstreet ¡Corridors ¡(Holladay, ¡Clackamas, ¡2nd, ¡6th, ¡Lloyd ¡Blvd) ¡ 2. Stormwater ¡“Parks” ¡(I-‑5, ¡Sullivan’s ¡Gulch, ¡Willameme ¡River) ¡ 3. Rose ¡Quarter ¡Green ¡Infrastructure ¡(separated ¡sewer ¡system) ¡ 4. “Lloyd ¡Park” ¡on ¡Clackamas ¡ 5. Superblock ¡Pocket ¡Parks ¡ 6. Educa4on ¡– ¡Healthy ¡Watershed/Healthy ¡People ¡Program ¡(incl. ¡district ¡dashboard) ¡ 1. Greenstreet ¡Corridors ¡(Holladay, ¡Clackamas, ¡2nd, ¡6th, ¡Lloyd ¡Blvd) ¡ 2. Stormwater ¡“Parks” ¡(I-‑5, ¡Sullivan’s ¡Gulch, ¡Willameme ¡River) ¡ 3. Rose ¡Quarter ¡Green ¡Infrastructure ¡(separated ¡sewer ¡system) ¡ 4. “Lloyd ¡Park” ¡on ¡Clackamas ¡ 5. Superblock ¡Pocket ¡Parks ¡ 6. Educa4on ¡– ¡Healthy ¡Watershed/Healthy ¡People ¡Program ¡(incl. ¡district ¡dashboard) ¡ 1. Exis4ng ¡Building ¡Waste ¡Management ¡Retrofit ¡Program ¡(reuse, ¡recycle, ¡compost) ¡ 2. New ¡Building ¡Waste ¡Management ¡Program ¡(reuse, ¡recycle, ¡compost) ¡ 3. District ¡Waste ¡Management ¡Program ¡(reuse, ¡recycle, ¡compost) ¡ 4. District ¡Energy ¡Recovery ¡ 5. Educa4on ¡– ¡Waste ¡educa4on ¡and ¡challenge ¡(including ¡district ¡dashboard) ¡
LLOYD INTEGRATED INFRASTRUCTURE STRATEGY – PRELIMINARY FINDINGS
LLOYD INTEGRATED INFRASTRUCTURE STRATEGY – PRELIMINARY FINDINGS
LLOYD INTEGRATED INFRASTRUCTURE STRATEGY – PRELIMINARY FINDINGS
Lloyd EcoDistrict Integrated Infrastructure Strategy - Investment Matrix (DRAFT) Investment Option A - Traditional Investment to Achieve Goal Option Base Case Public Private Cost Estimate PDC BES PBOT BPS Parks PWB Sub-Total COM RES IND COM RES IND Sub-Total DISTRICT DEVELOPMENT Buildings New Development - COM XXXX $0 XXXX $0 $0 New Development - RES XXXX $0 XXXX $0 $0 New Development - IND XXXX $0 XXXX $0 $0 Existing Development Retrofits - COM XXXX $0 XXXX $0 $0 Existing Development Retrofits - RES XXXX $0 XXXX $0 $0 Existing Development Retrofits - IND XXXX $0 XXXX $0 $0 Infrastructure Retail Commercial Streets - Civic XXXX XXXX $0 $0 $0 Retail Commercial Streets - District XXXX XXXX $0 $0 $0 Retail Commercial Streets - Neighborhood XXXX XXXX $0 $0 $0 Boulevard Streets - Civic XXXX XXXX $0 $0 $0 Boulevard Streets - District XXXX XXXX $0 $0 $0 Boulevard Streets - Neighborhood XXXX XXXX $0 $0 $0 Flexible Streets - Connection XXXX XXXX $0 $0 $0 Flexible Streets - Trail XXXX XXXX $0 $0 $0 Flexible Streets - Interior Connection XXXX XXXX $0 $0 $0 Lloyd Park XXXX XXXX $0 Sewer? XXXX $0 $0 $0 $0 Water? XXXX $0 $0 $0 $0 Buildings Sub-Total $0 $0 $0 $0 $0 $0 $0 $0 $0 $0 $0 $0 $0 $0 $0 $0 Infrastructure Sub-Total $0 $0 $0 $0 $0 $0 $0 $0 $0 $0 $0 $0 $0 $0 $0 $0 DISTRICT SUB-TOTAL $0 $0 $0 $0 $0 $0 $0 $0 $0 $0 $0 $0 $0 $0 $0 $0 #DIV/0! #DIV/0! #DIV/0! #DIV/0! #DIV/0! #DIV/0! #DIV/0! #DIV/0! #DIV/0! #DIV/0! #DIV/0! #DIV/0! #DIV/0! #DIV/0! #DIV/0! #DIV/0! THE EFFICIENT DISTRICT Energy Energy Conservation Retrofit Program - COM XXXX $0 XXXX $0 $0 Energy Conservation Retrofit Program - RES XXXX $0 XXXX $0 $0 Energy Conservation Retrofit Program - IND XXXX $0 XXXX $0 $0 Energy Conservation New (LEED Silver) - COM XXXX $0 $0 $0 $0 Energy Conservation New (LEED Silver) - RES XXXX $0 $0 $0 $0 Energy Conservation New (LEED Silver) - IND XXXX $0 $0 $0 $0 Energy Efficeint Street Light Retrofits XXXX XXXX $0 $0 $0 Energy Efficient Street Lights New XXXX XXXX $0 $0 $0 Renewables Retrofit Program - COM XXXX $0 XXXX $0 $0 Renewables Retrofit Prorgram - RES XXXX $0 XXXX $0 $0 Renewables Retrofit Program - IND XXXX $0 XXXX $0 $0 Renewables New - COM XXXX $0 XXXX $0 $0 Renewables New - RES XXXX $0 XXXX $0 $0 Renewables New - IND XXXX $0 XXXX $0 $0 District Energy Rose Quarter XXXX $0 Third Party $0 $0 District Energy East Node XXXX $0 Third Party $0 $0 District Energy Central Node XXXX $0 Third Party $0 $0 District Dashboard XXXX $0 $0 $0 Energy Monitoring and Conservation Challenge XXXX $0 $0 $0 Water Water Conservation and Reuse Retrofit Program - COM XXXX $0 XXXX $0 $0 Water Conservation and Reuse Retrofit Program - RES XXXX $0 XXXX $0 $0 Water Conservation and Reuse Retrofit Program - IND XXXX $0 XXXX $0 $0 Water Conservation and Reuse New (LEED Silver) - COM XXXX $0 $0 $0 Water Conservation and Reuse New (LEED Silver) - RES XXXX $0 $0 $0 Water Conservation and Reuse New (LEED Silver) - IND XXXX $0 $0 $0 Superblock Water Reuse Systems (RWH or WW) XXXX $0 Third Party? XXXX $0 $0 Sub-District Water Reuse System - Rose Quarter (RWH/WW) XXXX $0 Third Party $0 $0 Sub-District Water Reuse System - Lloyd Park (RWH/WW) XXXX $0 Third Party $0 $0 District Dashboard XXXX $0 $0 $0 Water Monitoring and Conservation Challenge XXXX $0 $0 $0 Waste $0 What are the additional strategies above current practices? $0 Energy Sub-Total $0 $0 $0 $0 $0 $0 $0 $0 $0 $0 $0 $0 $0 $0 $0 $0 Water Sub-Total $0 $0 $0 $0 $0 $0 $0 $0 $0 $0 $0 $0 $0 $0 $0 $0 Waste Sub-Total $0 $0 $0 $0 $0 $0 $0 $0 $0 $0 $0 $0 $0 $0 $0 $0 THE EFFICIENT DISTRICT SUB-TOTAL $0 $0 $0 $0 $0 $0 $0 $0 $0 $0 $0 $0 $0 $0 $0 $0 #DIV/0! #DIV/0! #DIV/0! #DIV/0! THE BIOPHILIC DISTRICT Sustainable Stormwater Sustainable Stormwater Retrofit Program - COM XXXX $0 $2,000,000 $2,000,000 $2,000,000 Sustainable Stormwater Retrofit Program - RES XXXX $0 $500,000 $500,000 $500,000 Sustainable Stormwater Retrofit Program - IND XXXX $0 $150,000 $150,000 $150,000 Sustainable Stormwater New (LEED Silver) - COM XXXX $0 $0 $0 Sustainable Stormwater New (LEED Silver) - RES XXXX $0 $0 $0 Sustainable Stormwater New (LEED Silver) - IND XXXX $0 $0 $0 Corridors and Nodes Greenstreet Corridor - Holladay Street XXXX XXXX $0 $0 $0 Greenstreet Corridor - Clackamas XXXX XXXX $0 $0 $0 Greenstreet Corridor - 2nd XXXX XXXX $0 $0 $0 Greenstreet Corridor - 6th XXXX XXXX $0 $0 $0 Greenstreet Corridor - Lloyd Blvd XXXX XXXX $0 $0 $0 Stormwater Park - Sullivan's Gulch XXXX XXXX $0 $0 $0 Stormwater Park - Willametter River XXXX XXXX $0 $0 $0 Stormwater Park - I-5 XXXX #VALUE! #VALUE! #VALUE! $0 #VALUE! Rose Quarter Green Infrastructure XXXX #VALUE! #VALUE! #VALUE! #VALUE! #VALUE! Superblock Pocket Parks XXXX $0 #VALUE! #VALUE! #VALUE! #VALUE! District Dashboard XXXX $0 $0 $0 Education (where should we put this stuff?) XXXX $0 $0 $0 Sustainable Stormwater Sub-Total $0 $0 $0 $0 $0 $0 $0 $0 $2,000,000 $500,000 $150,000 $0 $0 $0 $650,000 $650,000 Corridors and Nodes Sub-Total $0 $0 #VALUE! #VALUE! $0 $0 $0 #VALUE! $0 $0 $0 #VALUE! #VALUE! $0 #VALUE! #VALUE! THE BIOPHILIC DISTRIT SUB-TOTAL $0 $0 #VALUE! #VALUE! $0 $0 $0 #VALUE! $2,000,000 $500,000 $150,000 #VALUE! #VALUE! $0 #VALUE! #VALUE! #DIV/0! #VALUE! #VALUE! #VALUE! THE CONNECTED DISTRICT Is the connected district covered in the base district investments? $0 $0 $0 Bike Sharing $0 $0 $0 $0 $0 $0 THE CONNECTED DISTRICT SUB-TOTAL $0 $0 $0 $0 $0 $0 $0 $0 $0 $0 $0 $0 $0 $0 $0 $0 #DIV/0! ECODISTRICT SUBTOTAL $0 $0 #VALUE! #VALUE! $0 $0 $0 #VALUE! $2,000,000 $500,000 $150,000 #VALUE! #VALUE! $0 #VALUE! #VALUE! #DIV/0! #VALUE! #VALUE! #VALUE! #VALUE! #VALUE! #VALUE! #VALUE! #VALUE! #VALUE! #VALUE! #VALUE! #VALUE! #VALUE! #VALUE! #VALUE! TOTAL $0 $0 #VALUE! #VALUE! $0 $0 $0 #VALUE! $2,000,000 $500,000 $150,000 #VALUE! #VALUE! $0 #VALUE! #VALUE! #VALUE! #VALUE! #VALUE! Notes:(projects and programs)
(projects and programs)
(new and retrofits)
(finance, projects, utilities, etc.)
LLOYD INTEGRATED INFRASTRUCTURE STRATEGY – PRELIMINARY FINDINGS
$0 ¡ $200,000,000 ¡ $400,000,000 ¡ $600,000,000 ¡ $800,000,000 ¡ $1,000,000,000 ¡ $1,200,000,000 ¡ $1,400,000,000 ¡ $1,600,000,000 ¡ $1,800,000,000 ¡ District ¡ EcoDistrict ¡ Base ¡ Efficient ¡ Biophilic ¡
Base ¡Distrit ¡+ ¡EcoDistrict ¡ Investment ¡
Private ¡ Public ¡
EcoDistrict ¡Investment ¡ Only ¡
Private ¡ Public ¡
Biophilic ¡District ¡Investment ¡
Private ¡ Public ¡
¡Efficient ¡District ¡Investment ¡
Private ¡ Public ¡
Base ¡District ¡Investment ¡
Private ¡ Public ¡
Base ¡District ¡ Buildings ¡ EcoDistrict ¡ Infrastructure ¡
LLOYD INTEGRATED INFRASTRUCTURE STRATEGY – PRELIMINARY FINDINGS
short medium immediate 2015 2020 2025 2030 2035 2010 long
LLOYD INTEGRATED INFRASTRUCTURE STRATEGY – PRELIMINARY FINDINGS