
SLIDE 1
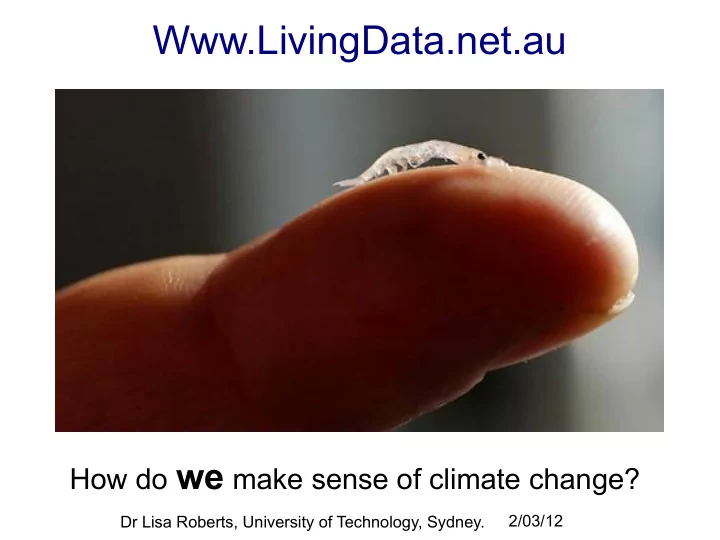
Www.LivingData.net.au
How do we make sense of climate change?
Dr Lisa Roberts, University of Technology, Sydney. 2/03/12
Www.LivingData.net.au How do we make sense of climate change? - - PowerPoint PPT Presentation
Www.LivingData.net.au How do we make sense of climate change? 2/03/12 Dr Lisa Roberts, University of Technology, Sydney. How can artistic methods expand understanding of scientific data? SCIENCE Aims to be objective and to arrive at
Dr Lisa Roberts, University of Technology, Sydney. 2/03/12
Rodolfo dell Valle, Methane release data, 2008
Andrea Juan, Methane, video Installation, 2008 Tracing (metaphorically) flows of methane with lengths of tulle Relating shapes and colours to feelings of threat Dynamically connecting through movement and touch
British Antarctic Survey, Antarctic bedrock, combined data sets, 2012
Lorraine Beaulieu, Drapeaux (flags), Cyanotype fabric installation, 2008 Tracing with fabric printing Relating to feelings of maternal connection and moral responsibility Dynamically connecting through spiral form and rhythmic placement of flags
Philippe Boissonnet, Earth Mother is becoming Earth Child (En perdre le nord), Digital photographic installation (detail), 2008 Tracing with drawing and colouring Relating to feelings of disorientation and maternal responsibility Dynamically connecting through spiral body gesture
John Church et al., World Climate Research Program,Tide gauge data, 2007
Lisa Roberts, Sea levels rising 01, engraved acrylic sheets, 2007 Tracing with engraving and paint inlay Relating lines and colours to observations of water
Tracing data on a Wacom drawing tablet with stylus, 2007
Tracing with line drawing Relating patterns to thoughts and feelings about invisible forces of change Dynamically connecting through animated lines and rising pitch of sound
Data showing the ‘sweet spot’ (at about 70 m), where most algae live. Height (y axis) represents levels of light (intensity) emitted from algae in response to microsecond flashes of red light. C3, 2011
Lisa Roberts, Algae happiness: Energy producing! Florescent acrylic, 2012 Tracing with engraving Relating green and red colours to feelings about health and happiness Dynamically connecting through touch and contrasting colours
Data from thermo sensors on a rock platform at Bilgola, NSW, 16 March 2010
location on the platform, from 12:20 to 17:20 hrs. C3 2011
Neptune's necklace (Hormosira Bankseii)
Tracing (metaphorically) with lines and sound rhythms Relating to knowledge of change over longer time periods Dynamically connecting through animated lines and shapes
Euphausia superba (Antarctic krill)
So Kawaguchi, Euphausia superba (Antarctic krill) video data, 2010 Tracing frame by frame with line drawings
Lisa Roberts, Krill mating dance sequence, Digital drawing, 2012 Relating movement pattern to thoughts about chance connections (Seeking moments in the 'dance' when the krill connect and disconnect)
Lisa Roberts, Krill mating dance sequence, Digital drawing, 2012 Relating a scientific theory to direct observation
Dynamically connecting through animated 'dance'
Marcus Geiser, Emliana-huxleyi, electron micrograph, 2002
Andrea Juan, Coccolithphorid, Object, 2010 Tracing (metaphorically) with 3D modelling Relating circular patterns to cycles of change in nature Dynamically connecting through visual rhythm and touch
Lisa Roberts, Cool me Cocco, Recycled glass, 2008 Tracing with engraving and paint inlay Relating to thoughts about global warning and recycling Dynamically connecting through touch and body memories of water (drinking, swimming)
Great Barrier Reef corals, Data unknown
Eveline Kolijn, Coral, Polystyrene foam, 2010 Tracing with a knife Relating coral patterns and found objects to global warning and recycling Dynamically connecting through touch
Eveline Kolijn, Coral Kaleidocycle - floor plan and object, Linocut, 2008 Tracing (metaphorically) with printing and folding Relating to the evolution of patterns in coral Dynamically connecting through touch and body memories of the sea