
SLIDE 1
Photo Credit Goes Here
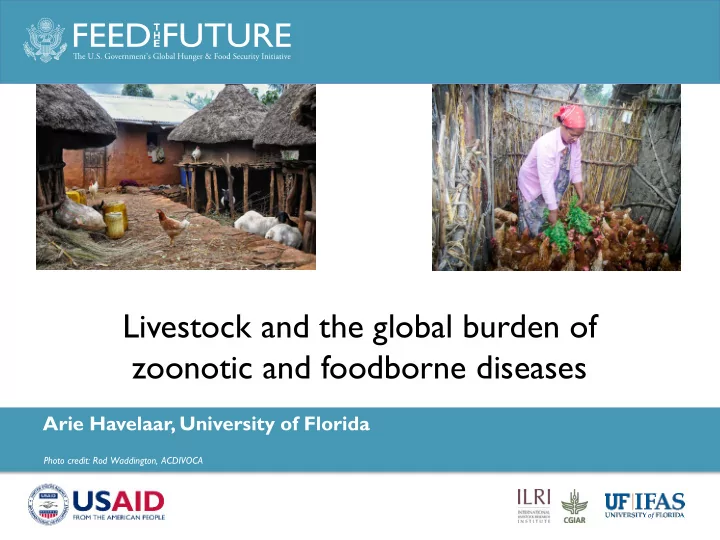
Photo credit: Rod Waddington, ACDIVOCA
Livestock and the global burden of zoonotic and foodborne diseases - - PowerPoint PPT Presentation
Livestock and the global burden of zoonotic and foodborne diseases Arie Havelaar, University of Florida Photo credit: Rod Waddington, ACDIVOCA Photo Credit Goes Here ANIMALS AS RESERVOIRS OF EMERGING INFECTIOUS DISEASES 61% of known human
Photo Credit Goes Here
Photo credit: Rod Waddington, ACDIVOCA
Wagenaar et al., Clin Infect Dis. 2013;57(11):1600-1606
AMR A AMR D AMR B AFR E AFR D EMR D EMR B EUR C EUR B EUR A
SEAR D
SEAR B WPR B WPR A
Incidence (millions) Deaths (thousands) DALYs (millions)
Food group Campylo- bacter STEC Salmonell a Crypto- sporidium Giardia Brucella E. granulosis T
ma Poultry 38-55 17-35 6-14 Pork 0-16 4-24 2-22 Beef 5-17 7-54 1-9 3-5 18-34 SR meat 4-11 7-26 2-7 3-19 8-44 Dairy 4-15 13-17 2-6 2-8 68-91 Eggs 9-26 Fruits 0-3 1-12 1-7 23-31 26-34 21-23 2-7 Vegetables 3-33 9-17 5-9 56-65 63-81 77-78 14-23
Hoffmann et al., submitted for publication Range of median proportions of disease attributed to different food groups by pathogen across subregions
Non-typhoidal
Toxoplasma gondii Campylobacter spp.Non-typhoidal
Non-typhoidal
Taenia solium Taenia solium Non-typhoidal
Non-typhoidal
Toxoplasma gondii Campylobacter spp.Campylobacter spp. Campylobacter spp.Taenia solium Cryptosporidium spp. Campylobacter spp.Cryptosporidium spp. Toxoplasma gondii Cryptosporidium spp. Campylobacter spp.Toxoplasma gondii Echinococcus granulosus Taenia solium Non-typhoidal
Toxoplasma gondii Cryptosporidium spp. Brucella spp. Brucella spp. Toxoplasma gondii Cryptosporidium spp.
Presentation at regional level rather than country level Large uncertainty intervals
Guerrant, R. L. et al. Nat. Rev. Gastroenterol. Hepatol. 2013;10:220-229.
Vietnam
https://www.defeatdd.org/blog/make-handwashing-habit-prevent-diarrhea…-and-grow-taller-too
Amour et al., 2015. Clin Infect Dis. 2016;63(9):1171-1179