
SLIDE 1
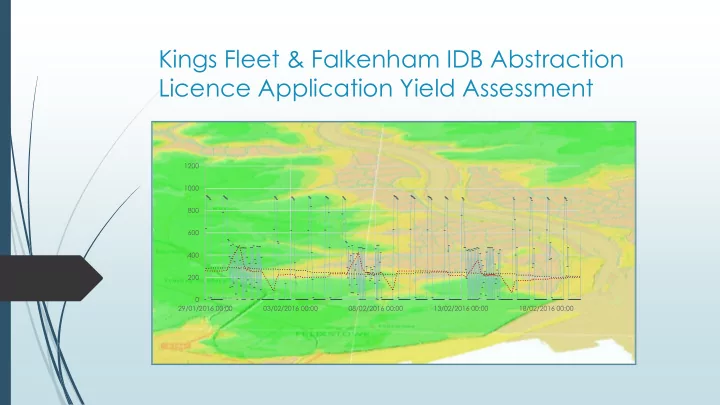
Kings Fleet & Falkenham IDB Abstraction Licence Application Yield Assessment
200 400 600 800 1000 1200 29/01/2016 00:00 03/02/2016 00:00 08/02/2016 00:00 13/02/2016 00:00 18/02/2016 00:00
Licence Application Yield Assessment 1200 1000 800 600 400 200 - - PowerPoint PPT Presentation
Kings Fleet & Falkenham IDB Abstraction Licence Application Yield Assessment 1200 1000 800 600 400 200 0 29/01/2016 00:00 03/02/2016 00:00 08/02/2016 00:00 13/02/2016 00:00 18/02/2016 00:00 Conjunctive use or Farm reservoir
200 400 600 800 1000 1200 29/01/2016 00:00 03/02/2016 00:00 08/02/2016 00:00 13/02/2016 00:00 18/02/2016 00:00
2000Ml.
Kings fleet and Falkenham
Fleet to Falkenham
Flows Enterprise; NEAC model ; Catchment comparison; Rainfall run off modelling .
modelmost suited to this application .
hydrological zones.
series of conceptual stores in each zone
Rainfall 1970-2015.
Inputs
weekly .
for Calibration – Levington for P.O.R. (inc other gauges for infilling).
kings fleet Pumps . Check with
Playford etc.
Aquifer 35%, Alluvium 32%, London clay 25%, Hard surface rapid 8%
200 400 600 800 1000 1200 01/01/2016 00:0006/01/2016 00:0011/01/2016 00:0016/01/2016 00:0021/01/2016 00:0026/01/2016 00:0031/01/2016 00:0005/02/2016 00:0010/02/2016 00:0015/02/2016 00:0020/02/2016 00:00
Kings fleet hourly Discharge 01/01/2016 to 11/03/2015
Series1 168 per. Mov. Avg. (Series1) 24 per. Mov. Avg. (Series1)
and 7 day – not hydrological – cost minimisation
. Maximum period of 7 day selected as filter .
rolling output .
rapid response functions of the catchment .
indicate good accuracy of gauged data (next slide)
50 100 150 200 250 300 350 400 450 20 40 60 80 100 120 15/07/2015 03/09/2015 23/10/2015 12/12/2015 31/01/2016 21/03/2016 10/05/2016 runoff mm Kings Fleet & Falkenham IDB pumped cumulative runoff compared to L.F.E. Mean monthly runoff. Data shown for Time period September 2015 to March 2016 - 96 % L.T.A. Rainfall L.F.E gauged L.T.A. Rainfall 2015/2016 Rainfall Series5
Mar 2016 run off compared to gauge and existing steady state models .
model . (95mm)
accurate metering .
200000 400000 600000 800000 1000000 1200000 1400000 1600000 1800000 2000000 CUBIC METRES
Cumulative Pumped Volume
Kings fleet Falkenham 2 Falkenham 1
hydrological zones .
duration curves .
20 40 60 80 100 120 140 160 180 200 0.00 0.05 0.10 0.15 0.20 0.25 0.30 Rainfall (mm) Flow (cumecs) Date
Contribution to Flows by Area (Kings fleet) Observed Rainfall Simulated Area 1: Gravel crag Area 2: Alluvium Area 3: London clay Area 4: Urban 8 per. Mov. Avg. (Observed) 7 per. Mov. Avg. (Simulated)
20 40 60 80 100 120 140 160 180 200 0.00 0.10 0.20 0.30 0.40 0.50 0.60 0.70 0.80 0.90 1.00 Rainfall (mm) Flow (cumecs) Date
Model Fit (Kings Fleet & Falkenham)
Observed Rainfall Simulated Flow 7 per. Mov. Avg. (Observed ) 7 per. Mov. Avg. (Simulated Flow)
periodicity.
peaks- attenuated by storage
aquifer baseflow trends.
underestimate of long term average yield
run off from marsh area , too high S.M.D. in shoulder months. ?
0.004 0.003 0.003 0.002 0.002 0.002 0.003 0.005 0.005 0.007 0.007 0.005 0.005 0.004 0.003 0.003 0.003 0.003 0.004 0.005 0.006 0.007 0.006 0.005 APR MAY JUN JUL AUG SEP OCT NOV DEC JAN FEB MAR
Modelled Run off M3/s/km2 - L.F.E. and Catchmod
Catchmod Low Flows Enterprise
runoff with steady state models .
10-15 % lower . Runoff dominated months 10-15 5 higher.
conceptualisation that L. f. E. model overestimates baseflow index @ 0.82 .
0.000 0.050 0.100 0.150 0.200 0.250 0.300 0.350 0.400 0.000 10.000 20.000 30.000 40.000 50.000 60.000 70.000 80.000 90.000 100.000
m3/sec Percentile
Catchmod and L.F.E. Mean Daily flow Duration curves
Modelled 1973-2015 L.F.E model calibration 7 day IDB gauged 7day
expected to exceed L.T.A.
significantly more run off than Long term 1970-2014 modelled
to conceptualisation of greater runoff and lower baseflow relative to existing model .
yield believed to be 10-15 % below actual .
5.9 6.4 6.9 7.4 7.9 8.4 8.9 9.4 9.9 0.000 0.020 0.040 0.060 0.080 0.100 0.120 0.140 18/02/1982 11/08/1987 31/01/1993 24/07/1998 14/01/2004 06/07/2009 27/12/2014 18/06/2020
Groundwater Level Maod
modelled flow m3/sec
Axis Title
Catchmod Calibration - Aquifer flows and Observed groundwater hydrographs
Gravel sim flows elm cottage levels Mill lane Boyton
0.000 0.100 0.200 0.300 0.400 0.500 0.600 0.700 0.800 0.900 1.000 01/05/1970 01/05/1971 01/05/1972 01/05/1973 01/05/1974 01/05/1975 01/05/1976 01/05/1977 01/05/1978 01/05/1979 01/05/1980 01/05/1981 01/05/1982 01/05/1983 01/05/1984 01/05/1985 01/05/1986 01/05/1987 01/05/1988 01/05/1989 01/05/1990 01/05/1991 01/05/1992 01/05/1993 01/05/1994 01/05/1995 01/05/1996 01/05/1997 01/05/1998 01/05/1999 01/05/2000 01/05/2001 01/05/2002 01/05/2003 01/05/2004 01/05/2005 01/05/2006 01/05/2007 01/05/2008 01/05/2009 01/05/2010 01/05/2011 01/05/2012 01/05/2013 01/05/2014
m3/sec
Kings Fleet modelled Total flow and Crag/gravel Baseflow
2015 ( calibrated to weekly)
component.
significant summer yield . Model believed to underestimate crag flows in dry years . Q(bf) mean = 0.025m3/sec . Probable 0.030m3/sec
119mm, MORECS/HOST gridded 127mm (baseflow component)
2481 2551 978 866 2050 1365 2354 1285 1909 1550 1591 1833 1447 1657 2199 1741 2053 4618 1902 1035 732 870 1191 2302 2542 1135 661 1013 1422 1563 5141 2793 2613 1112 1419 778 2253 2291 2747 1636 1623 803 3846 2620 3555 2524
1 9 7 0 1 9 7 1 1 9 7 2 1 9 7 3 1 9 7 4 1 9 7 5 1 9 7 6 1 9 7 7 1 9 7 8 1 9 7 9 1 9 8 0 1 9 8 1 1 9 8 2 1 9 8 3 1 9 8 4 1 9 8 5 1 9 8 6 1 9 8 7 1 9 8 8 1 9 8 9 1 9 9 0 1 9 9 1 1 9 9 2 1 9 9 3 1 9 9 4 1 9 9 5 1 9 9 6 1 9 9 7 1 9 9 8 1 9 9 9 2 0 0 0 2 0 0 1 2 0 0 2 2 0 0 3 2 0 0 4 2 0 0 5 2 0 0 6 2 0 0 7 2 0 0 8 2 0 0 9 2 0 1 0 2 0 1 1 2 0 1 2 2 0 1 3 2 0 1 4 2 0 1 5
IDB POTENTIAL GROSS YIELD KINGS FLEET & FALKENHAM
Modelled gross yield Catchmod Mean Gross yield IDB Estimated Mean yield
1000 2000 3000 4000 5000 6000 0.0 20.0 40.0 60.0 80.0 100.0 120.0
Potential yield Ml % Probability Of Available yield
Yield /Probability Curve - 1970-2015
Irrigation Only Scheme Multi use Scheme
fully optimised. Unrestricted infrastructure capability
% chance of non-availability in any year.
% risk of non- availability.
100 % reliable.
calibration Reasonable assumption to increase dry year yield by 10-15%
0.000 0.050 0.100 0.150 0.200 0.250 0.300 01/05/1995 01/06/1995 01/07/1995 01/08/1995 01/09/1995 01/10/1995 01/11/1995 01/12/1995 01/01/1996 01/02/1996 01/03/1996 01/04/1996 01/05/1996 01/06/1996 01/07/1996 01/08/1996 01/09/1996 01/10/1996 01/11/1996 01/12/1996 01/01/1997 01/02/1997 01/03/1997 01/04/1997 01/05/1997 01/06/1997 01/07/1997 01/08/1997 01/09/1997 01/10/1997 01/11/1997 01/12/1997 01/01/1998 01/02/1998 01/03/1998 01/04/1998
m3/sec
Kings Fleet modelled Total flow and Crag/gravel Baseflow Design year 1995-1997