
SLIDE 1
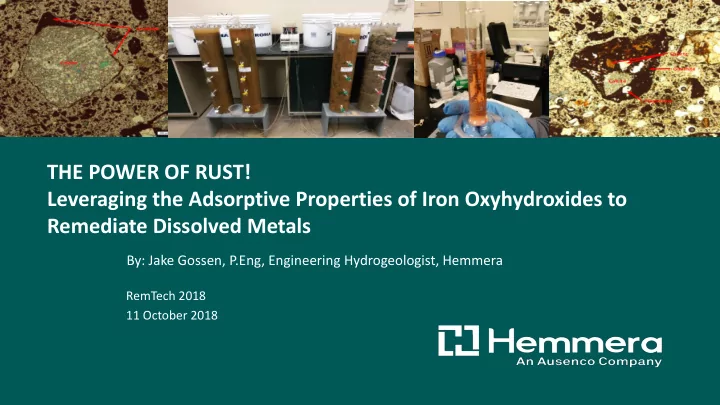
THE POWER OF RUST! Leveraging the Adsorptive Properties of Iron Oxyhydroxides to Remediate Dissolved Metals
By: Jake Gossen, P.Eng, Engineering Hydrogeologist, Hemmera
RemTech 2018 11 October 2018
Leveraging the Adsorptive Properties of Iron Oxyhydroxides to - - PowerPoint PPT Presentation
THE POWER OF RUST! Leveraging the Adsorptive Properties of Iron Oxyhydroxides to Remediate Dissolved Metals By: Jake Gossen, P.Eng, Engineering Hydrogeologist, Hemmera RemTech 2018 11 October 2018 Definitions Iron Oxyhydroxides = Hydrous
RemTech 2018 11 October 2018
0.1 0.2 0.3 0.4 0.5 0.6 0.7 0.8 0.9 0.1 1 10 100 1000 24-Feb 01-Mar 06-Mar 11-Mar 16-Mar 21-Mar 26-Mar 31-Mar 05-Apr 10-Apr
Dissolved Copper Concentration [µg/L] Sample Date
Graph A: Column 1 (100%) Results
Dissolved Copper [ug/L] Influent Dissolved Copper [ug/L] Distance From Base of Column [m]
Distance From Base of Column [m]
0.1 0.2 0.3 0.4 0.5 0.6 0.7 0.8 0.9 0.1 1 10 100 1000 24-Feb 01-Mar 06-Mar 11-Mar 16-Mar 21-Mar 26-Mar 31-Mar 05-Apr 10-Apr
Dissolved Copper Concentration [µg/L] Sample Date
Graph B: Column 2 (125%) Results
Dissolved Copper [ug/L] Influent Dissolved Copper [ug/L] Distance from Base of Column [m]
Distance From Base of Column [m]
0.1 0.2 0.3 0.4 0.5 0.6 0.7 0.8 0.9 0.1 1 10 100 1000 24-Feb 01-Mar 06-Mar 11-Mar 16-Mar 21-Mar 26-Mar 31-Mar 05-Apr 10-Apr
Dissolved Copper Concentration [µg/L] Sample Date
Graph C: Column 3 (75%) Results
Dissolved Copper [ug/L] Influent Dissolved Copper [ug/L] Distance from Base of Column [m]
Distance From Base of Column [m]
0.1 0.2 0.3 0.4 0.5 0.6 0.7 0.8 0.9 1 0.1 1 10 100 1000 24-Feb 01-Mar 06-Mar 11-Mar 16-Mar 21-Mar 26-Mar 31-Mar 05-Apr 10-Apr
Dissolved Copper Concentration [µg/L] Sample Date
Graph D: Column 4 (Control) Results
Dissolved Copper [ug/L] Influent Dissolved Copper [ug/L] Distance From Base of Column [m]
Distance From Base of Column
5 10 15 20 25 01-Mar 06-Mar 11-Mar 16-Mar 21-Mar 26-Mar 31-Mar 05-Apr 10-Apr
Dissolved Oxygen Concentration [mg/L] Sample Date
Graph E: Dissolved Oxygen Measurements
Column 1 Column 2 Column 3 Column 4
2 4 6 8 10 12 14 01-Mar 06-Mar 11-Mar 16-Mar 21-Mar 26-Mar 31-Mar 05-Apr 10-Apr
MEesured pH Value Measurement Date
pH Measurements
Column 1 Column 2 Column 3 Column 4
Parameter Column 1 [mg/L] Column 2 [mg/L] Column 3 [mg/L] Column 4 [mg/L] Chloride 125 129 129 126 Sulfate 365 257 1180 87.9 Fluoride 0.11 0.12 0.04 0.21 Bromide 0.10 0.10 0.10 0.11 Dissolved Aluminum 0.005 <0.004 <0.004 0.005 Dissolved Antimony <0.001 <0.001 <0.001 <0.001 Dissolved Arsenic <0.001 <0.001 <0.001 <0.001 Dissolved Barium <0.05 <0.05 <0.05 0.11 Dissolved Beryllium <0.001 <0.001 <0.001 <0.001 Dissolved Boron 0.08 0.02 0.04 0.07 Dissolved Cadmium <0.000016 <0.000016 <0.000016 <0.000016 Dissolved Chromium <0.001 0.033 0.009 <0.001 Dissolved Cobalt <0.0009 <0.0009 <0.0009 <0.0009 Dissolved Copper <0.0008 0.0010 <0.0008 0.0705 Dissolved Iron <0.1 <0.1 <0.1 <0.1 Dissolved Lead <0.0005 <0.0005 <0.0005 <0.0005 Dissolved Manganese 0.020 <0.005 <0.005 0.086 Dissolved Molybdenum <0.001 0.001 0.001 0.002 Dissolved Nickel <0.003 <0.003 <0.003 <0.003 Dissolved Selenium 0.0008 0.0016 <0.0005 <0.0005 Dissolved Silver 0.00011 0.00006 <0.00005 <0.00005 Dissolved Sodium 67.6 70.1 69.3 67.8 Dissolved Thallium <0.0001 <0.0001 <0.0001 <0.0001 Dissolved Titanium <0.001 0.001 <0.001 <0.001 Dissolved Uranium <0.001 <0.001 <0.001 0.001 Dissolved Zinc <0.005 <0.005 <0.005 <0.005
Jake Gossen P.Eng. jgossen@hemmera.com Hemmera Suite 804, 322 11th Avenue SW Calgary, AB T2R 0C5