
SLIDE 1
85 90 95 00 05
Year
100 90 80 70 60 50 40 30
Level of skill (%)
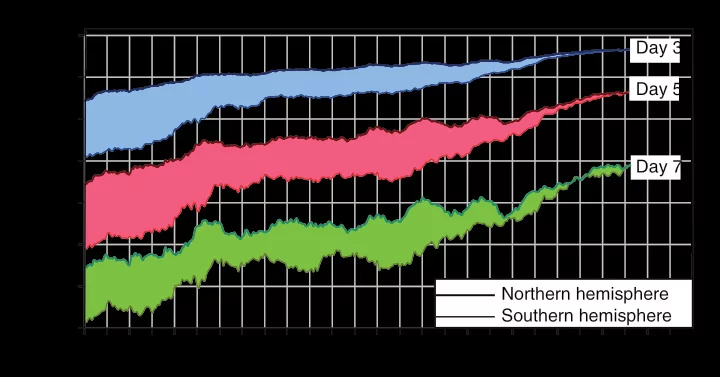
Day 7 Northern hemisphere Southern hemisphere Day 5 Day 3
Level of skill (%) 80 70 Day 7 60 50 40 Northern hemisphere - - PowerPoint PPT Presentation
100 Day 3 90 Day 5 Level of skill (%) 80 70 Day 7 60 50 40 Northern hemisphere Southern hemisphere 30 85 90 95 00 05 Year concentration (ppm by volume) 380 370 Atmospheric CO 2 360 350 Mauna Loa 340 South Pole 330 320
85 90 95 00 05
Year
100 90 80 70 60 50 40 30
Level of skill (%)
Day 7 Northern hemisphere Southern hemisphere Day 5 Day 3
5860 65 70 75 80 85 90 95 0002 310 320 330 340 350 360 370 380 Year Atmospheric CO2 concentration (ppm by volume) Mauna Loa South Pole
φ
North Pole South Pole E q u a t
λ λ = φ =
P O
φ
r
RE c
permission restriction.
20 40 60 80 100 120 140 160 10–8 10–7 10–6 10–5 10–4 10–3 10–2 10–1 1 10 102 103 Pressure (hPa) Density (g m–3) Mean free path (m) Height above sea level (km)
10 20 30 40 50 60 90 100 160 180 200 220 240 260 280 300 Temperature (K) Height (km) 1000 100 10 1 0.1 0.01 0.001 300 80 70 Pressure (hPa) Thermosphere Mesopause Mesosphere Stratopause Stratosphere Troposphere Tropopause
[Photograph courtesy of Rose Toomer and Bureau of Meteorology, Australia.]
100 80 60 40 20 Height (km) 90 70 50 30 10 10 30 50 70 90 100 10 1 0.1 0.01 0.00
–60 –40 –20 –100 –60 –20 –20 –40 –40 –60 20 –40 –60 –70 –40
Summer hemisphere Winter hemisphere Equator
–60 –80 –40 –20
Pressure (hPa) 100 80 60 40 20 Height (km) 0.01 0.1 1 10 100 1000 0.001 90° 70° 50° 30° 10° 10° 30° 50° 70° 90° Summer hemisphere Winter hemisphere Equator E W W
W W
Pressure (hPa) 1000
H L H L
SP NP
cyclones anticyclones
Hadley cells North Pole Tropospheric jet stream J J L L H H H L L H H H
H L North Pole Equator
H H
Equator Pacific and Atlantic Oceans ITCZ Equator Indian Ocean Monsoon
20 m s–1
T T T T T T T M W W w W W M
120E 60E 180 120W 60W 60S 30S 30N 60N 60S 30S 30N 60N
H H H H H H H L L L L
60 E 120 E 180 120W 60W
20 m s–1
60S 30S 30N 60N 60S 30S 30N 60N
Billows along the top of this cloud layer reveal the
[Photograph courtesy of Brooks Martner, NOAA.]
[PhotographcourtesyofPatrickMcCracken, NASAHeadquarters.]
60E 120E 180 120W 60W 60S 30S 30N 60N 60E 120E 180 120W 60W 60S 30S 30N 60N
200 300 400 500 100
48N 46N 44N 42N 40N 38N 36N 34N 32N 124W 122W 120W 118W116W 114W122W 110W 108W 106W 104W 102W100W
100 80 60 40 30 20 16 12 10 8 5 2