The State-of-nature: (Basically) a collection of all the - - PDF document

the
SMART_READER_LITE
LIVE PREVIEW

The State-of-nature: (Basically) a collection of all the - - PDF document

1/15/2020 Department of Veterinary and Animal Sciences Department of Veterinary and Animal Sciences Outline 1. Summary of Mondays lecture 2. The SimFlock model User interface Monte Carlo Simulation II State variables


slide-1
SLIDE 1

1/15/2020 1

Monte Carlo Simulation II

Anders Ringgaard Kristensen and Dan Børge Jensen

Department of Veterinary and Animal Sciences

Outline

  • 1. Summary of Monday’s lecture
  • 2. The SimFlock model
  • User interface
  • State variables
  • Decision variables

State of nature

  • Hyper distribution
  • Output variables
  • 3. Use of the simulation model
  • Running simulation jobs
  • Results and interpretation
  • 4. Simulation as a decision support tool

Department of Veterinary and Animal Sciences Advanced Quantitative Methods in Herd Management Slide 2

Summary from Monday

Simulation models, two (main) types:

  • 1. Deterministic: no randomness – same input, same output
  • 2. Stochastic: random sampling – same input, different output
  • 1. Random sampling is done using random number

generation with an appropriate distribution function State-of-nature:

  • (Basically) a collection of all the information that describes

the system, you are trying to model Uncertainty of the state-of-nature:

  • Each parameter of the s.o.n is specified through a

distribution instead of a value.

  • Such a distribution is called a hyper distribution.
  • The parameters of a hyper distribution are called hyper

parameters. The SimBatch model

  • A simulation model implemented in R
  • Fairly straight forward – you could make one yourself!

Department of Veterinary and Animal Sciences

The SimFlock Model

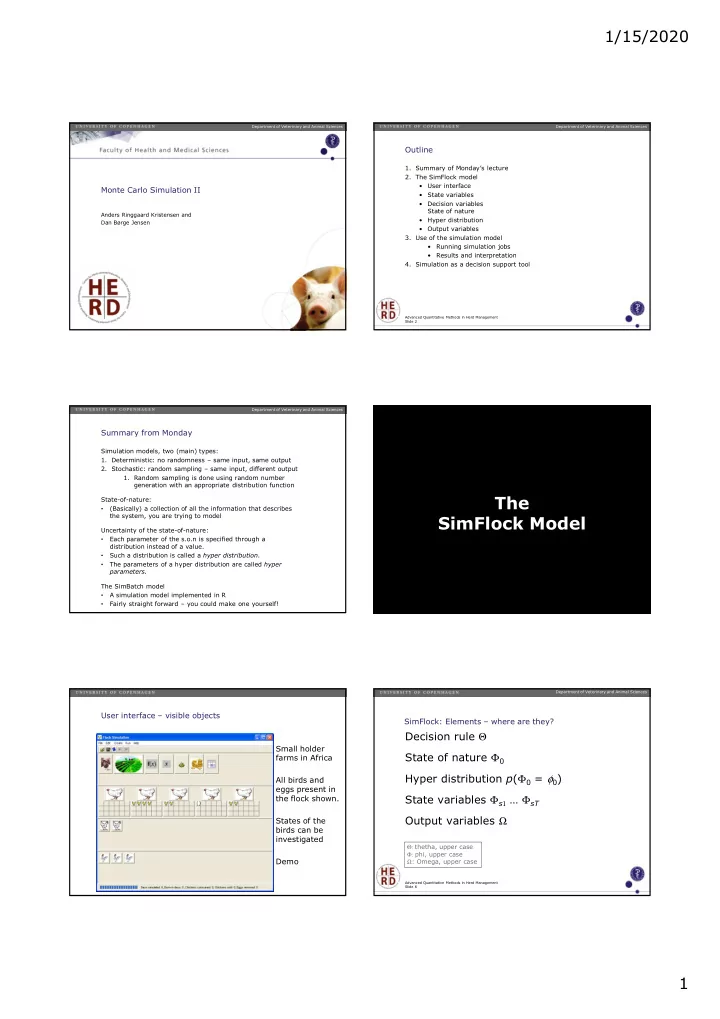
User interface – visible objects Small holder farms in Africa All birds and eggs present in the flock shown. States of the birds can be investigated Demo SimFlock: Elements – where are they?

Decision rule Θ State of nature Φ0 Hyper distribution p(Φ0 = φ0) State variables Φs1 … ΦsT Output variables Ω

Advanced Quantitative Methods in Herd Management Department of Veterinary and Animal Sciences Slide 6

Θ: thetha, upper case Φ: phi, upper case Ω: Omega, upper case

slide-2
SLIDE 2

1/15/2020 2

SimFlock: An object oriented model

Breeding animals Hens & Cocks Eggs Chicks Growers Pullets Cockerels Household consumption Market Dead Infertile

Department of Veterinary and Animal Sciences

The farmer, birds, and eggs are represented as

  • bjects in the

model! SimFlock: State variables of the objects

The state variables of day i are the states of the individual birds and eggs on that day:

  • Eggs:
  • Fertilized/not fertilized
  • Birds:
  • Age
  • Weight
  • Growth potential
  • Full grown weight
  • Laying capacity
  • Gender
  • Farmer:
  • Needs meat?

There are millions of state variables in a simulation run.

Department of Veterinary and Animal Sciences

Specific state variables: Cocks: No further states Chicks and growers: Growth state

Pullet: Age at “puberty”, Growth state Cockerel: Age at “puberty”, Growth state Hen: Behavior, Laying capacity, State in cycle, Days since transition in cycle, Eggs at incubating Eggs in nest, Fertile eggs in nest

SimFlock: Decision variables

Built-in decisions (farmer icon):

  • Intended flock size:
  • Hens
  • Cocks
  • Egg removing policy
  • Days from start laying
  • Season
  • Policy for buying breeding birds:
  • Hens
  • Cocks

Other decisions modeled through expected effects (e.g. on mortality).

Advanced Quantitative Methods in Herd Management Department of Veterinary and Animal Sciences Slide 9

5 Minute Break

Distribution of state of nature: Main problem

It is difficult to specify the distribution of the state of nature. Solution:

  • We use hyper distributions
  • The hyper parameters are stimated from production data

from 30 flocks in Zimbabwe.

  • Easy, if parameters are independent
  • Difficult if they interact

For a systematic description of the approach used in the SimFlock model, reference is made to Kristensen & Pedersen (2003) – link at the homepage.

Advanced Quantitative Methods in Herd Management Department of Veterinary and Animal Sciences Slide 11

Example: Mortality in SimFlock It is expected that the mortalities of different bird groups in the same flock are correlated – this should be included in the model! Mortality is represented as survival rates p. If we observe N birds over a given period and count the number n that survive, then n is binomially distributed with parameters p and N with p ~ n/N. If other factors influence p (e.g. the bird group) we can express the effect in a logistic model (standard tool for dealing with binomially distributed data)

Advanced Quantitative Methods in Herd Management Department of Veterinary and Animal Sciences Slide 12

slide-3
SLIDE 3

1/15/2020 3

The Logit-transformation

Logit

  • 4
  • 3
  • 2
  • 1

1 2 3 4 0,2 0,4 0,6 0,8 1 p Logit(p)

The Logit-transformation converts a probability p ∈ [0;1] to a value y ∈ ]-∞;∞[. The transformed variable, y, may be used as response variable in “usual” regression analysis etc.

The SimFlock survival rate model

logit(pij) = µ + αj + Fi + (αF)ij Where

  • µ is the intercept
  • α1, α2, α3, α4 are the systematic effects of bird groups

(i.e. chicks, growers, pullets and cockerels)

  • Fi ~ N(0, σF) is the random effect of flock
  • (αF)ij ~ N(0, σαF) is the random interaction between

flock and bird group.

State of nature parameters: pi1, pi2, pi3, pi4, i.e. a survival rate for each bird group. Hyper parameters: µ, α1, α2, α3, α4, σF, σαF – estimated from field data from 30 flocks in Zimbabwe.

Department of Veterinary and Animal Sciences

Defining the Survival state of nature

  • sampling from the hyper distribution

Draw a random effect of flock Fi from N(0, σF

2)

Draw 4 random bird/flock interaction values (αF)i1, (αF)i2, (αF)i3, (αF)i4 from N(0, σαF

2)

Calculate the 4 logit values (j = 1, 2, 3, 4)

yij = logit(pij) = µ + αj + Fi + (αF)ij

Transform to 4 survival rates (j = 1, 2, 3, 4) log(pij/(1-pij)) = yij ⇔ pij = 1/(e-yij + 1)

Department of Veterinary and Animal Sciences

SimFlock: State of nature parameters In SimFlock, a state of nature is described by 42 parameters:

  • Daily gains of birds, general linear model
  • Survival rates, logistic model
  • Full grown weights, normal distribution
  • Age at puberty, normal distribution
  • Egg fertilization probability, beta distribution
  • Egg hatching probability, logistic model
  • Number of eggs before incubation, normal dist.

Each time a parameter is defined, a hyper distribution is specified.

Advanced Quantitative Methods in Herd Management Department of Veterinary and Animal Sciences Slide 16

SimFlock: Hyper distribution(s) The hyper distribution of the state of nature is specified through 64 hyper parameters. Most of them estimated from the field data collected in 30 flocks. A state of nature drawn from the hyper distribution represents

  • ne (hypothetical) flock.
  • By drawing e.g. many states of nature we can generate many

realistic hypothetical flocks.

  • Decision rules may have different effects in different flocks.

Advanced Quantitative Methods in Herd Management Department of Veterinary and Animal Sciences Slide 17

SimFlock: Output variables

A total of 40 are defined:

  • Realised gain
  • Realised mortality
  • Eggs removed
  • Chickens produced

Usual technical and economical key figures.

Advanced Quantitative Methods in Herd Management Department of Veterinary and Animal Sciences Slide 18

slide-4
SLIDE 4

1/15/2020 4

10 Minute Break

Use of the simulation model

Use of the simulation model

System comprehension

  • Answering “what if” questions

General decision support (at population level)

  • The main purpose of SimFlock

Decision support at flock level

  • Not yet possible

Advanced Quantitative Methods in Herd Management Department of Veterinary and Animal Sciences Slide 21

System comprehension Usually carried out under one state of nature Answer questions like:

  • If we assume the state of nature parameters are

Φ0 = φ0 what are then the consequences?

  • What if we could improve the survival rate of

chicks?

  • Vary the survival rate systematically – run

simulations and explore the results

  • etc.

Weakness: State of nature parameters are mutually correlated!

Advanced Quantitative Methods in Herd Management Department of Veterinary and Animal Sciences Slide 22

General decision support Population level Carried out under multiple states of nature Questions like:

  • Under what circumstances does it pay to change

the decision rule from Θ1 to Θ2?

  • Generate multiple states of nature

(random flocks)

  • Run a simulation job under Θ1
  • Run a simulation job under Θ2
  • Identify the states of nature where it pays

Advanced Quantitative Methods in Herd Management Department of Veterinary and Animal Sciences Slide 23

Defining a simulation job in SimFlock

Create an initial flock Specify:

  • Number of states of nature (if more than 1)
  • A question of obtaining a representative sample of flocks

from the abstract population.

  • Number of replications per state of nature
  • How precise do you want the results for each flock to be?
  • Mean values
  • Distribution
  • Number of days to simulate
  • A long simulation period will increase the precision
  • Burn-in days
  • We want to ignore the effect of the initial flock.

Advanced Quantitative Methods in Herd Management Department of Veterinary and Animal Sciences Slide 24

slide-5
SLIDE 5

1/15/2020 5

Simulation jobs: Considerations Monte Carlo simulation involves huge amounts of numerical calculations. It produces huge amounts of data. Computer capacity may still be a problem

  • Start the simulation at the office Friday afternoon
  • See the results Monday morning
  • Buy the biggest hard disk in the catalogue in
  • rder to store the output

Advanced Quantitative Methods in Herd Management Department of Veterinary and Animal Sciences Slide 25

Analyzing the results A herd simulation model produces output of the same kind as real world herds:

  • Must be analyzed according to the same principles

as field data:

  • Calculation of means, standard deviations,

percentiles etc.

  • Graphical plots
  • Variance and regression analysis, but
  • Be careful with the usual significance

concept

Advanced Quantitative Methods in Herd Management Department of Veterinary and Animal Sciences Slide 26

The significance concept

In simulated data, we know that the tested policies (or parameter sets) are different:

  • If we simulated with
  • Enough replications
  • Sufficiently long periods
  • - then all differences are significant.

Estimate the size of the difference with any desired precision.

Advanced Quantitative Methods in Herd Management Department of Veterinary and Animal Sciences Slide 27

Results in SimFlock Shown in tables Exported to files for analysis with other tools:

  • Excel
  • R
  • SAS

The exercises

Advanced Quantitative Methods in Herd Management Department of Veterinary and Animal Sciences Slide 28

Simulation as a decision support tool

Properties of methods for decision support

Department of Veterinary and Animal Sciences

slide-6
SLIDE 6

1/15/2020 6

Simulation as a decision support tool

  • When do we use (MC) simulation?

When other methods fail

  • Evaluation of decision strategies
  • Consequences of deviating production results
  • Consequences of implementing research results in

practice.

A good answer to the (almost) mandatory question at exam:

  • Could you have used an other method to analyze

the problem you have worked with?

  • (Question 2: How would you do it)

Advanced Quantitative Methods in Herd Management Department of Veterinary and Animal Sciences Slide 31

Break and exercises, until 17:00