Lessons Learned From Sequenced, Integrated Strategies of Economic - - PowerPoint PPT Presentation

lessons learned from sequenced integrated strategies of
SMART_READER_LITE
LIVE PREVIEW

Lessons Learned From Sequenced, Integrated Strategies of Economic - - PowerPoint PPT Presentation

Lessons Learned From Sequenced, Integrated Strategies of Economic Strengthening of the Lessons Learned From Sequenced, Integrated Strategies of Economic Strengthening of the Poorest Poorest March 21, 2012 Lessons Learned From Sequenced,


slide-1
SLIDE 1

Lessons Learned From Sequenced, Integrated Strategies of Economic Strengthening of the Poorest

microlinks.kdid.org/afterhours

After Hours Seminar

Like us on Facebook

facebook.com/microlinks

#MLevents

Participate during the seminar

Follow us on Twitter

twitter.com/microlinks
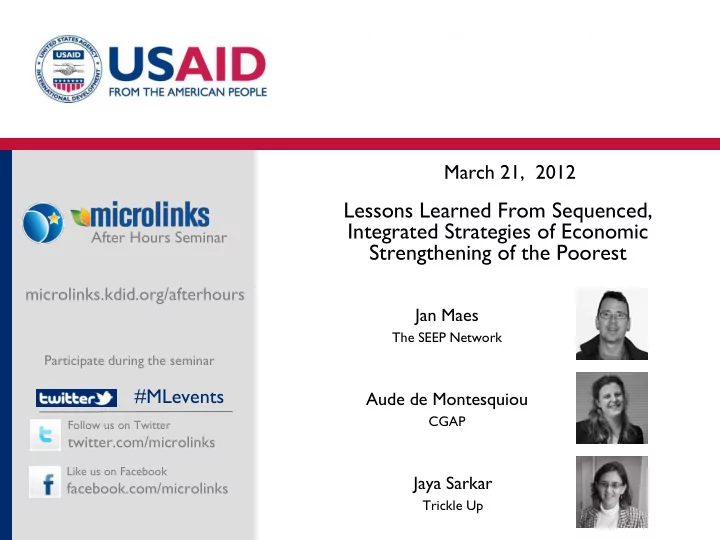
March 21, 2012

Lessons Learned From Sequenced, Integrated Strategies of Economic Strengthening of the Poorest

Aude de Montesquiou

CGAP

Jaya Sarkar

Trickle Up

Jan Maes

The SEEP Network

Lessons Learned From Sequenced, Integrated Strategies of Economic Strengthening of the Poorest

slide-2
SLIDE 2
  • Economic Strengthening for the Ultra-Poor
  • Integrated, sequenced strategies
  • CGAP Ford Foundation Graduation Model
  • Trickle Up: the first steps out of poverty
  • Integrating push and pull strategies
  • STEP UP’s learning initiative

Outline

slide-3
SLIDE 3

Economic Strengthening of the Ultra-Poor

slide-4
SLIDE 4

Roadblocks of the past

  • Fundraising and anecdotal evidence
  • Cost and reachability
  • Perceived versus actual poverty levels (a measurement

problem)

  • The microenterprise myth
  • Poor understanding of poverty and vulnerability
  • Stovepipe syndrome
slide-5
SLIDE 5

What is extreme poverty?

  • Living below the extreme poverty line
  • Living below the survival threshold
  • Suffering chronic food insecurity
  • Being highly vulnerable
  • Stuck in a poverty trap: asset base with very low returns
slide-6
SLIDE 6

Zooming In

  • Great variability in nature and degree
  • f poverty/vulnerability
  • How to assess?

– Household livelihood assets (SLF) – Household Economy Approach (HEA)

  • Important implications for strategy

and success

  • Examples
slide-7
SLIDE 7

Economic Strengthening strategies

  • ES = activities, programs and policies aimed at building

the economic capacity of individuals and households

– Financial Services – Market Development – Social Assistance – Enabling Environment – Local Capacity Building

  • Graduation Model: example of integration and

sequencing

slide-8
SLIDE 8

Market Development Microfinance Social Assistance Enabling Environment Capacity Building

ES for UP ES for UP

slide-9
SLIDE 9

Lessons Learned From Sequenced, Integrated Strategies of Economic Strengthening of the Poorest

Aude de Montesquiou March 21, 2012

CGAP: Lessons Learned From Sequenced, Integrated Strategies of Economic Strengthening of the Poorest

slide-10
SLIDE 10

Destitute Extreme Poor Moderate Poor Vulnerable Non-Poor Non-Poor Wealthy

Microfinance rarely reaches the poorest

Microfinance Poverty Outreach

slide-11
SLIDE 11

Sequencing Interventions

safety nets + livelihoods + microfinance

promotion transformation creating ladders protection prevention sequencing

slide-12
SLIDE 12

Critical Partnerships

Healthcare

  • r other Service

Provider

NGO, government agency,

  • r other

Livelihoods Provider

NGO, government agency, or other

Financial Service Provider

MFI or other (SHG, Post Office, etc.)

Fonkoze Foundation Fonkoze MFI

Partners in Health NGO

Trickle Up NGO Self Help Groups

Government clinics

slide-13
SLIDE 13

The Graduation Model

slide-14
SLIDE 14

CGAP Ford Foundation Graduation Program

Haiti - India - Pakistan - Honduras - Peru - Ethiopia - Yemen - Ghana

slide-15
SLIDE 15

10 Pilots: Different Stages

Fonkoze, Haiti 150 participants 2006-2008 Scale up to 1,300 participants Plans for 5,000 by 2015 Bandhan, West Bengal, India 300 participants 2006-2008 Scaled up to 2,400 participants, now scaling to 55,000 by 2014 SKS NGO, Andhra Pradesh, India 426 participants 2007-2009 Scale up to 1,750 participants. Plans for 12,000 by 2015 Trickle Up, West Bengal, India 300 participants 2007-2009 Scale up to 300 participants. Plans for 1,000 in 2011 PLAN & ODEF, Lempira, Honduras 800 participants 2009-2011 PLAN & Arawiwa, Cusco, Peru 800 participants 2010-2012 REST, Tigray, Ethiopia 500 participants 2010-2012 Social Welfare Fund & Social Fund for Development, Aden, Yemen 500 participants 2011-2013 PPAF& partners, Sindh, Pakistan 1,000 participants 2008-2010 Plans to scale up to 1,000 in 2011 Presbyterian Agricultural Station & IPA, Tamale, Ghana 2011-2013

slide-16
SLIDE 16

Under Close Scrutiny

Documenting program implementation Distilling lessons for course correction and model refinement All pilots Monitoring Tracking participant progress All pilots RCT impact assessments Measuring impact 8 pilots Qualitative research Understanding change 9 pilots

slide-17
SLIDE 17

Qualitative and Monitoring Results: Fonkoze

Food security:

  • Food insecurity with hunger declined by over 50%
  • Severe wasting among CLM children decreased from 13% to 4%

Assets and Savings:

  • PPI scores show16% of participants passed the

$1/day line

  • Savings hiked at first but were not sustained
  • Ownership of large livestock increased from

5% to 39% Empowerment:

  • Increased self-confidence and enterprise skills
  • Increase in family planning

Health:

  • Attending health clinics increased from 14% to 46%

Schooling:

  • All or most children regularly attending school increased from 27% to 70%
slide-18
SLIDE 18

Initial RCT Results: Bandhan

Food Security:

  • 25% average monthly increase in consumption, especially in nutritious food (fruit,

nuts, diary, eggs and meat)

  • Less likely to skip or reduce meals

Financial Services:

  • Beneficiaries save on average nearly x2 control group
  • Beneficiaries score higher on an index of financial autonomy

Health:

  • Increase in health knowledge (hand washing, etc.)
  • Decreased emotional stress and increased life satisfaction
  • Little impact on physical health

Schooling:

  • Children spend more time tending livestock … but also spend an average additional

20 minutes per day on school work

slide-19
SLIDE 19

Initial RCT Results: SKS

Consumption:

  • No significant increases in consumption
  • Shift in income: agriculture  livestock

Financial services:

  • Less likely to borrow from money lender
  • Decreased amounts of outstanding loans

by 84% of initial average amount

  • More likely to be saving, impact on amount is uncertain

Health:

  • Reported being sick less: lost 2 fewer work days (in month prior to interview) to

sickness (which is 56% of baseline number of days lost)

  • 12% less likely to have gone to doctor/hospital in past year

Schooling:

  • No impact on children in school
slide-20
SLIDE 20

Still learning

/

http://graduation.cgap.org

slide-21
SLIDE 21

Advancing financial access for the world’s poor

www.cgap.org www.microfinancegateway.org

Thank You

slide-22
SLIDE 22

Trickle Up: The First Steps out of Poverty

slide-23
SLIDE 23

Trickle Up believes in the potential of the poorest and

most vulnerable—the ultra-poor—to become agents of change in their household, joining together with peers to create a world where it is no longer acceptable for anyone to live in extreme poverty.

Trickle Up Mission

slide-24
SLIDE 24

Where we work

slide-25
SLIDE 25

Graduation: From pilot to proof-of-concept

  • Changed sequence of

intervention

  • Stronger focus on self-

help groups

  • Targeted handholding

after first year

slide-26
SLIDE 26

Unexpected areas of impact

  • Self-Help Group collective

action

  • Intergenerational poverty
  • Scale: depth to breadth
slide-27
SLIDE 27

Mali: Solidarity groups after 3 years

2.48 2.90 2.88 2.20 2.40 2.60 2.80 3.00 0% 25% 50% 75% 100% Baseline 2008 Year 1 (2009) Year 3 (2011) Participants

Participant Meals Per Day

Three meals Average meals 252 520 1026 200 400 600 800 1000 1200

Baseline (2008) Year 1 (2009) Year 3 (2011)

West African CFA Francs*

Average Daily Food Expenditure

slide-28
SLIDE 28

Mali collective actions

  • 37% of solidarity groups have created

a social fund, to support members during times of hardship

  • 16% are extending loans to non-

members, thus benefitting other community members

  • 35% are engaged in group investments

such as animal fattening, trade, and cereal banks

  • 53% of groups are legally registered,

enabling applications for funding of community projects and bank linkages

slide-29
SLIDE 29

India collective actions

  • 87% attendance rates at self-help

group meetings 2-1/2 years into the project, against end-of-project target of 90%

  • TU capturing data on collective

actions, including closing liquor shops, improving community infrastructure, cleaning wells, and advocating for better service from banks

slide-30
SLIDE 30

Intergenerational poverty

slide-31
SLIDE 31

Scale: Depth to breadth

slide-32
SLIDE 32

Helping others to break down barriers

slide-33
SLIDE 33

Questions

Questions?

slide-34
SLIDE 34

Integration and Sequencing: Lessons Learned and Ways Forward

slide-35
SLIDE 35

Innovations within disciplines

Discipline Value Proposition Weaknesses Innovations Social Safety Nets

Provides a lifeline; allows people to move above survival threshold Is not designed to link to economic opportunity (Keep households from falling down, but do little to help them move up) e.g. savings-linked CCT

Microfinance

Access to financial services Income/expenditure smoothing Increase microenterprise profit Products often not matching customer needs: smoothing household consumption, asset protection, asset building Savings Groups Microcredit Plus e.g. health e.g. agricultural e.g. financial literacy Microinsurance Social Performance

Market Development

Making markets work for those ready to grow Destitute and struggling HH do not participate directly Link to push strategies Focus on low-risk, economic activities with low barriers to entry

slide-36
SLIDE 36

Push strategies build livelihood assets

  • Examples: social capital (support mechanisms,

bargaining power); confidence building; savings; conditional cash transfers, asset transfers, food stipends…

  • At all levels: provision to protection to promotion
  • Push ≠ Subsidy
  • Often accompanied by effective targeting
  • Exclusive focus on push strategies is not

sustainable and creates dependence

slide-37
SLIDE 37

Pull strategies are about inclusion

  • Systems, processes, institutions
  • Examples: MFI customizes products or links to

savings groups; government social safety net programs; VCD project engages very poor producers in VC multi-stakeholder platforms

  • Ultra-poor as producers, consumers, workers
  • At all levels: provision to protection to promotion
  • Some key features: facilitation, direct provision

(social enterprise), systemic approach

  • Exclusive focus does not reach the ultra-poor

(directly)

slide-38
SLIDE 38

Examples of integrated approaches

  • Graduation Program

– Trickle Up – Fonkoze

  • PSNP+ Ethiopia

– CARE’s Pathways to Empowerment

  • AMPATH Kenya
  • Grameen Foundation with BASIX’s The

Livelihood School

– Livelihoods Pathways for the Poorest

slide-39
SLIDE 39

PSNP Plus Causal Model

(source: CARE)

slide-40
SLIDE 40

Regular Coaching: Health Support, Social Messaging

Poverty Extreme Poverty

0 months 6 months 3 months 24 months 9 months

Consumption Support Skills training Savings Services (GISE)

Sustain. Livelihoods

THE GRADUATION MODEL

Access to Credit

AMPATH Kenya

slide-41
SLIDE 41

Fonkoze’s Staircase out of Poverty

slide-42
SLIDE 42

How to connect Push and Pull?

  • Balancing act of demand and supply of

economic opportunity

  • Push strategies need to be sustainable –
  • ne-time interventions often aren’t
  • Coordination is essential: step up is more

difficult than fall down

  • Replace pathways with segmentation
  • Systemic approach – no single player can

do this job alone

slide-43
SLIDE 43
  • Primary focus on ultra-poor
  • Connecting silos of practice
  • Integrated, systemic approaches:

assessment, design, implementation, evaluation and learning

  • Role of facilitation and coordination
  • Advocacy and link to other initiatives

Step Up Approach

slide-44
SLIDE 44

Multi-disciplinary learning

  • Stakeholder consultations and learning events
  • One-stop shop resource center
  • Mapping of initiatives, tools and resources
  • STEP UP Webinar Series
  • Development of learning modules and resources
slide-45
SLIDE 45

Next on the learning agenda?

  • Join the conversation:

http://linkd.in/seepstepup

  • STEP UP concept paper
  • Graduation Program learning events
slide-46
SLIDE 46

Lessons Learned From Sequenced, Integrated Strategies of Economic Strengthening of the Poorest

Please visit microlinks.kdid.org/afterhours for seminar presentations and papers After Hours Seminar

Microlinks and the After Hours Seminar Series are products of Knowledge-Driven Microenterprise Development Project (KDMD), funded by USAID’s Microenterprise Development office.

March 21, 2012

Jan Maes

janpmaes@yahoo.com

Aude de Montesquiou

ademontesquiou@worldbank.org

Jaya Sarkar

jsarkar@trickleup.org

Visit Microlinks.org