
SLIDE 1
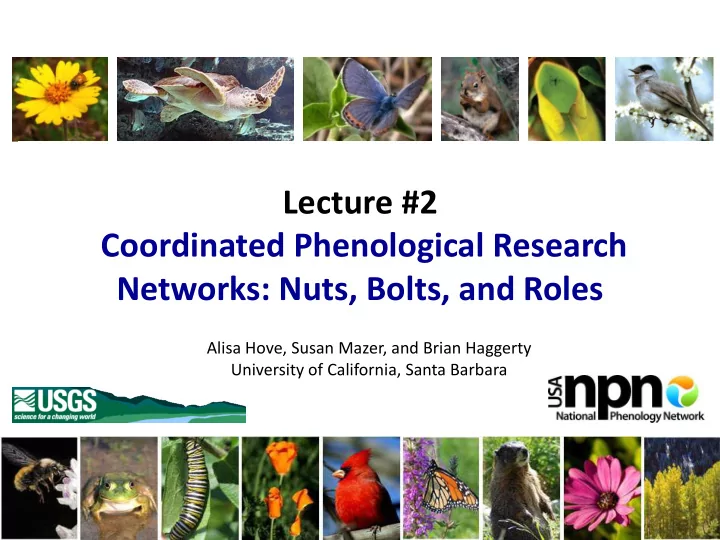
Lecture #2 Coordinated Phenological Research Networks: Nuts, Bolts, and Roles
Alisa Hove, Susan Mazer, and Brian Haggerty University of California, Santa Barbara
Lecture #2 Coordinated Phenological Research Networks: Nuts, Bolts, - - PowerPoint PPT Presentation
Lecture #2 Coordinated Phenological Research Networks: Nuts, Bolts, and Roles Alisa Hove, Susan Mazer, and Brian Haggerty University of California, Santa Barbara Phenology is the science of the seasons Spring wildflowers Migration patterns
Alisa Hove, Susan Mazer, and Brian Haggerty University of California, Santa Barbara
Spring wildflowers Foliage color change Migration patterns
2
Predict and address hazards Plan cultural and recreational events Understand human health and food security issues
Wildflower displays
Predict and address hazards Plan cultural and recreational events Understand human health and food security issues
Wildflower displays
analysis
coordinated research?
Clonal lilac monitoring (northern U.S.) the USA National Phenology Network
the California Phenology Project
Examples:
Northeast Regional Phenology Network University of California, Santa Barbara Phenology Stewardship Program
Phenological information has numerous practical applications. Phenological research networks have been established in numerous countries. Intro to Coordinated Research National Level State Level Regional Level Summary
Some examples (there are many more):
In the United States, phenological research is coordinated by the USA National Phenology Network
(NGOs), academia, the public
www.usanpn.org
Intro to Coordinated Research National Level State Level Regional Level
Breaking buds Young leaves Open Flowers Full Flowering
in backyards and gardens
Intro to Coordinated Research National Level State Level Regional Level
in backyards and gardens
To show the effects of elevation and latitude on the onset of spring To assess climate change throughout the U.S.
Intro to Coordinated Research National Level State Level Regional Level
= Lilac phenology monitored for several decades = Average # days after Jan-1 that Lilac leafs out
Mean SI First Leaf 1990-1993 & 1995-1999, Courtesy M. Schwartz
Cayan et al. 2001, Bull. Amer. Meteor. Soc.
Cayan et al. 2001, Bull. Amer. Meteor. Soc.
coordinated research?
Clonal lilac monitoring (northern U.S.) the USA National Phenology Network
the California Phenology Project
Examples:
Northeast Regional Phenology Network University of California, Santa Barbara Phenology Stewardship Program
www.usanpn.org
a project of the USA-NPN
Several ways to participate
www.usanpn.org
Most recent 1000 registered sites participation www.usanpn.org Each brown dot represents the location of a NPN citizen scientist (as of Aug 2011)
Most recent 1000 registered sites participation www.usanpn.org
24
Liz Matthews
25
26
Liz Matthews
28
29
coordinated research?
Clonal lilac monitoring (northern U.S.) the USA National Phenology Network
the California Phenology Project
Examples:
Northeast Regional Phenology Network University of California, Santa Barbara Phenology Stewardship Program
31
Intro to Coordinated Research National Level State Level Regional Level
32
Recreation Area
National Recreation Area
National Parks Intro to Coordinated Research National Level State Level Regional Level
33
COLLABORATORS NPS Climate Change Response Program 2010 FUNDING
34
In 2011 & 2012, training botanists, ecologists, and education specialists at six pilot national parks in CA. They are learning how to conduct phenological monitoring (using USA-NPN protocols and
www.usanpn.org/cpp
COLLABORATORS NPS Climate Change Response Program 2010 FUNDING
coordinated research?
Clonal lilac monitoring (northern U.S.) the USA National Phenology Network
the California Phenology Project
Examples:
Northeast Regional Phenology Network University of California, Santa Barbara Phenology Stewardship Program
Photo: Mickaw2 via Wikimedia Commons Photo: Joby Joesph
Appalachian dogwood eastern bluebird
monitoring that incorporates remote sensing webcams
Image: http://klima.sr.unh.edu/gallery.html
Coal Oil Point Natural Reserve UCSB Santa Barbara Botanic Garden Cesar Chavez Charter Elementary Franklin Elementary
Gevirtz Graduate School of Education Cheadle Center for Biodiversity & Ecological Restoration
Ecology, Evolutio n, and Marine Biology
Westside Boys and Girls Club
Unite existing scientific networks Facilitate and promote phenological monitoring by citizen scientists & educational institutions California Phenology Project