Leap frog (2): Innovative Technologies CO 2 reduction by passenger - - PowerPoint PPT Presentation

leap frog 2 innovative technologies co 2 reduction by
SMART_READER_LITE
LIVE PREVIEW

Leap frog (2): Innovative Technologies CO 2 reduction by passenger - - PowerPoint PPT Presentation

Leap frog (2): Innovative Technologies CO 2 reduction by passenger car high technology diffusion Scenarios (China) - Without tech. 1,400 diffusion CO 2 emission from passenger car Over 600Mt CO 2 /year 1,200 ( 44%) With CCS


slide-1
SLIDE 1

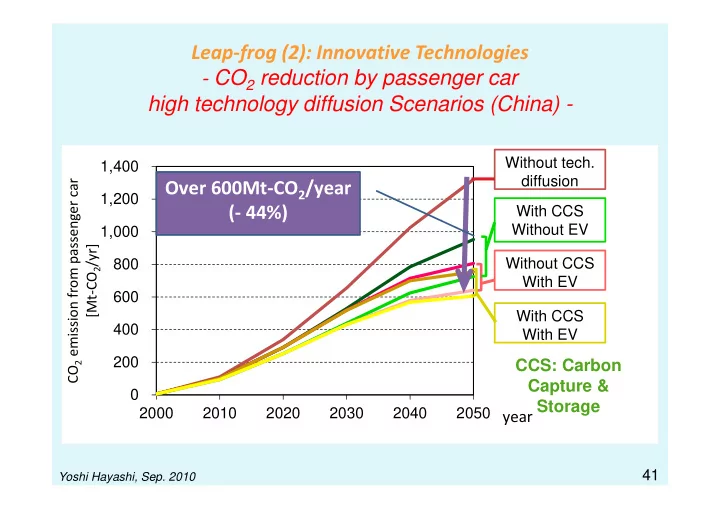
Leap‐frog (2): Innovative Technologies ‐ CO2 reduction by passenger car high technology diffusion Scenarios (China) -

200 400 600 800 1,000 1,200 1,400 2000 2010 2020 2030 2040 2050 CO2 emission from passenger car [Mt‐CO2/yr]

year

With CCS Without EV Without CCS With EV With CCS With EV Without tech. diffusion

Over 600Mt‐CO2/year (‐ 44%)

CCS: Carbon Capture & Storage

41

Yoshi Hayashi, Sep. 2010

slide-2
SLIDE 2

Income Growth & Low Birth Rate/Aging

Yoshitsugu Hayashi, Nagoya University 42

slide-3
SLIDE 3

for Evaluation Monitoring Criteria & Indicators for Evaluation

Eco alance

  • 1. Original

Eco-balance Human Activities /Disruptions 2.Changes /Disruptions 3.Conflicts / Crises Eco balance 8.New Eco-balance

Implementation

Water Transport Energy Bio-Diversity

Sustainability indices Environment and resource efficiency

View on Nature and Ethics

  • 6. Technologies

/Policy Packages

  • 5. Alternative Paths
  • 5. Alternative Paths

/Strategies

  • 4. Setting Goals

& Benchmarks

  • 7. Consensus

Human Activities Proposed Process for Sustainability Studies

43 Yoshitsugu Hayashi, Nagoya University

PRESCRIPTION DIAGNOSIS

slide-4
SLIDE 4

44

1/2.04 1/2.13 1/1.28

Germany

1/1.48 1/2.14 1/1.04

Japan

1950 2000 2050

1/1.63 1/2.15 1/1.56

China Korea

1/1.24 1/2.55 1/1.20 1/1.4

1900

Singapore

1/1.12 1/2.97

Yoshitsugu Hayashi, Nagoya University

slide-5
SLIDE 5

0.0 1.0 2.0 3.0 4.0 5.0 6.0 7.0 5,000 10,000 15,000 20,000 25,000 30,000 35,000 40,000 45,000 50,000 China India Korea, Rep United Kingdom United States Viet Nam Thailand Japan Germany

Developed countries Developing Asia

Total birth rate GDP per capita [US $]

Yoshitsugu Hayashi, Nagoya University

slide-6
SLIDE 6

Growing Small / Smart Shrink

Yoshitsugu Hayashi, Nagoya University 46

slide-7
SLIDE 7

What do the Changes of Economic, Geographic and Demographic Factors Mean ?

Yoshitsugu Hayashi, Nagoya University

slide-8
SLIDE 8

Bangkok

48 Yoshitsugu Hayashi, Nagoya University

slide-9
SLIDE 9

Hanoi

49 Yoshitsugu Hayashi, Nagoya University

slide-10
SLIDE 10

Yoshitsugu Hayashi, Nagoya University 50