
SLIDE 1
2015/5/31 1
Lean Operations and TPS
The History of Toyota Seven Sources of Waste JIT and Quality Improvement Flexibility, Standardization, and HR Practices
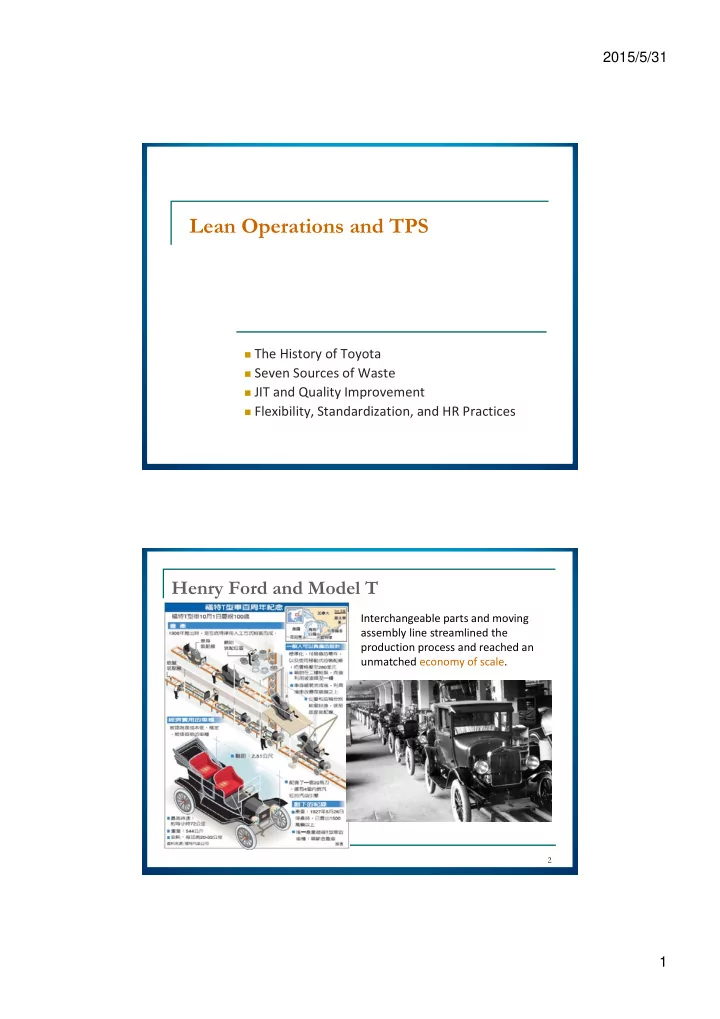
Henry Ford and Model T
2
Lean Operations and TPS The History of Toyota Seven Sources of - - PDF document
2015/5/31 Lean Operations and TPS The History of Toyota Seven Sources of Waste JIT and Quality Improvement Flexibility, Standardization, and HR Practices Henry Ford and Model T Interchangeable parts and moving assembly line
The History of Toyota Seven Sources of Waste JIT and Quality Improvement Flexibility, Standardization, and HR Practices
2
Toyota switched from automated looms to
Shortage of supplies led to simplistic design
3
Mass production, with its emphasis on scale economies and
Secondhand equipment and high unit costs forced Toyota to
TPS is the outcome of a long evolution.
4
20 40 60 80 100 120 140 160
Aug-89 Aug-90 Aug-91 Aug-92 Aug-93 Aug-94 Aug-95 Aug-96 Aug-97 Aug-98 Aug-99 Aug-00 Aug-01 Aug-02 Aug-03 Aug-04 Aug-05 Aug-06 Aug-07
Stock Price in US$ Toyota GM Ford
1000 2000 3000 4000 5000 6000 7000 8000 9000 10000 1965 1988 2000 2006
Toyota GM Ford
The first true proof of superiority of TPS. GM failed to reduce non‐value‐added
5
6
Zero non‐value added activities (muda) Zero defects, zero breakdowns, zero inventory, zero set‐up Production flow synchronized with demand (JIT)
One‐unit‐at‐a‐time flow Mixed model production (heijunka) Piece‐by‐piece transfer (ikko‐nagashi) Match production demand based on Takt time Pull instead of push Supermarket / Kanban Make‐to‐order
Quality methods to reduce defects
Fool‐proofing (poka‐yoke) and visual feed‐back Detect‐stop‐alert (Jidoka) Defects at machines (original Jidoka) Defects in assembly (Andon cord) Build‐in‐quality (tsukurikomi)
Flexibility Standardization of work Worker involvement
Quality circles (Kaizen) Fishbone diagrams (Ishikawa) Skill development / X‐training Reduction of Variability Quartile Analysis Standard operating procedures Adjustment of capacity to meet takt‐time Multi‐task assignment (takotei‐mochi)
Reduce inventory to expose defects
10.3 10.4 10.5 10.6 10.7 10.9 10.8
Overproduction: too much or too early Waiting: idle time and low utilization Transport: internal transport does not create value Over‐processing: use expensive materials or spend too
Inventory: hide problems and leads to long flow times Rework: “Do it right the first time” Motion: use the right tool and avoid unnecessary body
7
8
Most nurses spend too much time on non‐nursing activities. This waste leads to heavy workload for nurses, poor care for
Only 60% of the capacity of an operating room is used
gaps in the schedule procedure is cancelled room cleaning time procedure delays because of late arrivals
9
An elevator is a batch process which leads to long wait times. Escalators keep people moving constantly without waiting.
10
Most large scale operations have operated based on MRP and
Extensive periods of large inventories or customer backorders
TPS aims at reducing FGI by operating its process in
11
Customer demand is translated
12
13
14
15
Make‐to‐order: every flow unit in the process is assigned to
Low volume and large variety Customers are willing to wait Inventory is expensive
Kanban: a flow unit in the process is not designated to fill any
High volume and low variety Short order lead times Costs and efforts to store the components are low
16
Zero defects lead to operations without
Pokayoke (fool‐proofing) reduces the
17
Jidoka means stopping the process
Quality inspection is built in at every
Inventory covers up problems. Gradually reducing inventory exposes
18 Inventory in process Buffer argument: “Increase inventory” Toyota argument: “Decrease inventory”
Need flexible processes to meet demand fluctuations. Flexible processes requires multiple‐skilled workers. The management should provide standard operating
19 If demand is high, takt time=1 minute
Step 1
If demand is low, takt time = 2 minutes
Step 2 Step 3 Step 4 Step 5 Step 6 Step 1 Step 2 Step 3 Step 4 Step 5 Step 6
The eighth source of waste: human intellect “In our company, we all have two jobs: (1) to do our job and
Quality circles bring workers together to jointly solve
Lifelong employment for the core workers. Strong emphasis on skill development Financial rewards
20
21
There is more to a successful operational turnaround than
An emphasis on flow, matching supply with demand, and a
A management infrastructure based
Mindsets of employees are involved
22