lavaan and the history of structural equation 2. the history of SEM, - - PowerPoint PPT Presentation

lavaan and the history of structural equation
SMART_READER_LITE
LIVE PREVIEW

lavaan and the history of structural equation 2. the history of SEM, - - PowerPoint PPT Presentation

Department of Data Analysis Ghent University Department of Data Analysis Ghent University Overview 1. what is lavaan; news and updates lavaan and the history of structural equation 2. the history of SEM, from a computational point of view 3.


slide-1
SLIDE 1

Department of Data Analysis Ghent University

lavaan and the history of structural equation modeling

Yves Rosseel Department of Data Analysis Ghent University Psychoco 2012 February 9–10, 2012 – Universit¨ at Innsbruck, Austria

Yves Rosseel lavaan and the history of structural equation modeling 1 / 12 Department of Data Analysis Ghent University

Overview

  • 1. what is lavaan; news and updates
  • 2. the history of SEM, from a computational point of view
  • 3. lavaan and the history of SEM

Yves Rosseel lavaan and the history of structural equation modeling 2 / 12 Department of Data Analysis Ghent University

What is lavaan?

  • http://lavaan.org
  • lavaan is an R package for latent variable analysis
  • the long-term goal: to provide a collection of tools that can be used to ex-

plore, estimate, and understand a wide family of latent variable models, in- cluding factor analysis, structural equation, longitudinal, multilevel, latent class, item response, and missing data models

  • today: lavaan (version 0.4) is a package for structural equation modeling

with continuous data

  • one of main attractions of lavaan is its intuitive and easy-to-use model syntax

Yves Rosseel lavaan and the history of structural equation modeling 3 / 12 Department of Data Analysis Ghent University

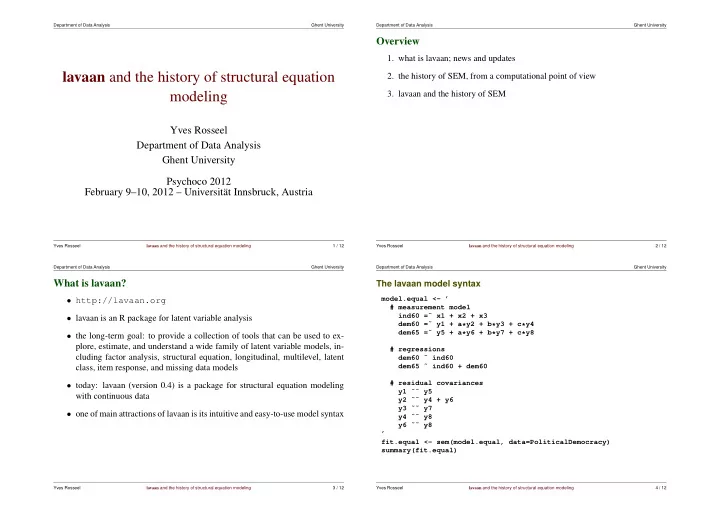
The lavaan model syntax

model.equal <- ’ # measurement model ind60 =˜ x1 + x2 + x3 dem60 =˜ y1 + a*y2 + b*y3 + c*y4 dem65 =˜ y5 + a*y6 + b*y7 + c*y8 # regressions dem60 ˜ ind60 dem65 ˜ ind60 + dem60 # residual covariances y1 ˜˜ y5 y2 ˜˜ y4 + y6 y3 ˜˜ y7 y4 ˜˜ y8 y6 ˜˜ y8 ’ fit.equal <- sem(model.equal, data=PoliticalDemocracy) summary(fit.equal)

Yves Rosseel lavaan and the history of structural equation modeling 4 / 12

slide-2
SLIDE 2

Department of Data Analysis Ghent University

The lavaan parameter table

id lhs op rhs user group free ustart exo label eq.id unco 1 1 ind60 =˜ x1 1 1 1 2 2 ind60 =˜ x2 1 1 1 NA 1 3 3 ind60 =˜ x3 1 1 2 NA 2 4 4 dem60 =˜ y1 1 1 1 5 5 dem60 =˜ y2 1 1 3 NA a 5 3 6 6 dem60 =˜ y3 1 1 4 NA b 6 4 7 7 dem60 =˜ y4 1 1 5 NA c 7 5 8 8 dem65 =˜ y5 1 1 1 9 9 dem65 =˜ y6 1 1 3 NA a 5 6 10 10 dem65 =˜ y7 1 1 4 NA b 6 7 11 11 dem65 =˜ y8 1 1 5 NA c 7 8 12 12 dem60 ˜ ind60 1 1 6 NA 9 13 13 dem65 ˜ ind60 1 1 7 NA 10 14 14 dem65 ˜ dem60 1 1 8 NA 11 15 15 y1 ˜˜ y5 1 1 9 NA 12 16 16 y2 ˜˜ y4 1 1 10 NA 13 17 17 y2 ˜˜ y6 1 1 11 NA 14 18 18 y3 ˜˜ y7 1 1 12 NA 15 ... 30 30 y7 ˜˜ y7 1 24 NA 27 31 31 y8 ˜˜ y8 1 25 NA 28 32 32 ind60 ˜˜ ind60 1 26 NA 29 33 33 dem60 ˜˜ dem60 1 27 NA 30 34 34 dem65 ˜˜ dem65 1 28 NA 31

Yves Rosseel lavaan and the history of structural equation modeling 5 / 12 Department of Data Analysis Ghent University

News and updates

linear and nonlinear equality and inequality constraints

Data <- data.frame( y = rnorm(100), x1 = rnorm(100), x2 = rnorm(100), x3 = rnorm(100) ) model.constr <- ’ # model with labeled parameters y ˜ b1*x1 + b2*x2 + b3*x3 # constraints b1 == (b2 + b3)ˆ2 b1 > exp(b2 + b3) ’ fit <- sem(model.constr, data=Data)

Yves Rosseel lavaan and the history of structural equation modeling 6 / 12 Department of Data Analysis Ghent University

defined parameters and mediation analysis

X <- rnorm(100) M <- 0.5*X + rnorm(100) Y <- 0.7*M + rnorm(100) Data <- data.frame(X = X, Y = Y, M = M) model <- ’ # direct effect Y ˜ c*X # mediator M ˜ a*X Y ˜ b*M # indirect effect (a*b) ab := a*b # total effect total := c + (a*b) ’ fit <- sem(model, data=Data)

Yves Rosseel lavaan and the history of structural equation modeling 7 / 12 Department of Data Analysis Ghent University

bootstrapping

# The famous Holzinger and Swineford (1939) example HS.model <- ’ visual =˜ x1 + x2 + x3 textual =˜ x4 + x5 + x6 speed =˜ x7 + x8 + x9 ’ # bootstrapping standard errors fit <- cfa(HS.model, data=HolzingerSwineford1939, se="bootstrap") # bootstrapping the test statistic (Bollen-Stine) fit <- cfa(HS.model, data=HolzingerSwineford1939, test="bootstrap", bootstrap=2000, verbose=TRUE) # bootstrapping anything fit <- cfa(HS.model, data=HolzingerSwineford1939) CFI.boot <- bootstrapLavaan(fit, FUN=fitMeasures, R=1000, type="parametric", verbose=TRUE, parallel="multicore", ncups=16, fit.measures="cfi")

Yves Rosseel lavaan and the history of structural equation modeling 8 / 12

slide-3
SLIDE 3

Department of Data Analysis Ghent University

The history of SEM, from a computational point of view

  • several traditions in the SEM (software) world:

– LISREL (Karl J¨

  • reskog)

– EQS (Peter Bentler) – Mplus (Bengt Muth´ en) – RAM-based approaches (AMOS, Mx, sem, OpenMx, . . . )

  • superficially, all SEM software packages produce the same results
  • there are some subtle (and less subtle) differences in the output
  • looking deeper, there are many computational differences

Yves Rosseel lavaan and the history of structural equation modeling 9 / 12 Department of Data Analysis Ghent University

Some differences

  • matrix representation

– standard number of matrices: LISREL: 8; Mplus: 4, EQS: 3, RAM: 2

  • optimization algorithm

– quasi-Newton, gradient-only + quasi-Newton, Gauss-Newton, . . .

  • variances constrained (strictly positive) versus unrestricted
  • constrained optimization algorithm

– mostly undocumented – a Lagrangian-multiplier variant, simple slacks, . . .

  • normal likelihood versus Wishart likelihood, ML versus GLS-ML (RLS)

– N versus N − 1 – GLS-ML based chi-square test statistic influences fit measures (CFI!)

Yves Rosseel lavaan and the history of structural equation modeling 10 / 12 Department of Data Analysis Ghent University

Some differences (2)

  • Satorra-Bentler/Yuan-Bentler scaled test statistic

– each program seems to use a different implementation – often asymptotically equivalent; but large differences in small samples

  • categorical data using the limited information approach

– Muth´ en 1984; J¨

  • reskog 1994; Lee, Poon, Bentler (1992)

– many ways to compute the asymptotic covariance matrix (needed for WLS)

  • naive bootstrapping, Bollen-Stine bootstrapping

– mostly undocumented; one-iteration bootstrap? – Bollen-Stine with missing data . . .

Yves Rosseel lavaan and the history of structural equation modeling 11 / 12 Department of Data Analysis Ghent University

lavaan and the history of SEM

  • lavaan is in many areas still trying to catch up with commercial software; but

instead of trying to implement one tradition (based on one program), lavaan tries to implement several traditions

  • all fitting functions in lavaan have a mimic argument which can be set to

"EQS" or "Mplus" respectively; "LISREL" is under development

  • this was originally intended to convince users that lavaan could produce

‘identical’ results as the (commercial) competition

  • it is now one of the main design goals of lavaan

lavaan and the future of SEM?

  • we need to (re)evaluate old/new/unexplored computational methods in many

areas (optimization, constrained inference, Bayesian techniques, limited in- formation estimation, . . . )

  • lavaan should ‘by default’ implement best practices in all areas

Yves Rosseel lavaan and the history of structural equation modeling 12 / 12