lavaan an r package for structural equation
play

lavaan : an R package for structural equation 2. introducing the - PowerPoint PPT Presentation

Department of Data Analysis Ghent University Department of Data Analysis Ghent University Overview 1. (gentle) introduction to structural equation modeling (SEM) lavaan : an R package for structural equation 2. introducing the lavaan package


  1. Department of Data Analysis Ghent University Department of Data Analysis Ghent University Overview 1. (gentle) introduction to structural equation modeling (SEM) lavaan : an R package for structural equation 2. introducing the lavaan package modeling and more 3. three small examples (cfa, sem, growth) 4. how does lavaan work? Yves Rosseel 5. future plans Department of Data Analysis Ghent University Psychoco 2011 – Tübingen Yves Rosseel lavaan : an R package for structural equation modeling and more 1 / 42 Yves Rosseel lavaan : an R package for structural equation modeling and more 2 / 42 Department of Data Analysis Ghent University Department of Data Analysis Ghent University 
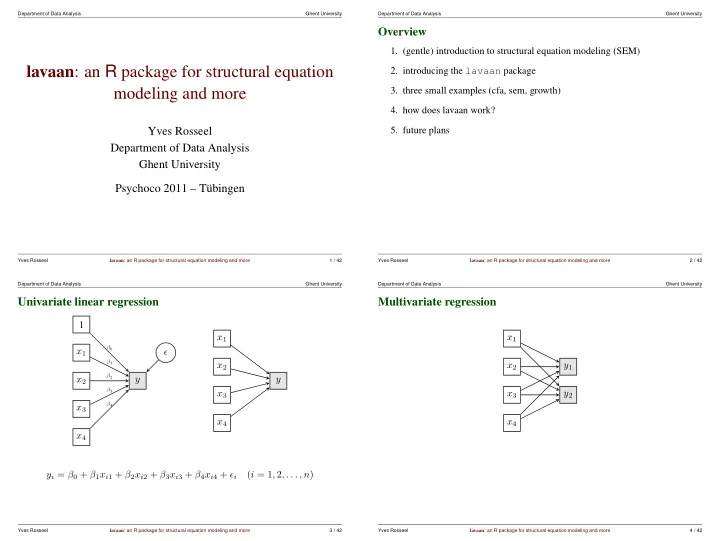
Univariate linear regression Multivariate regression 1 x 1 x 1 β 0 x 1 ǫ β 1 x 2 x 2 y 1 β 2 x 2 y y β 3 x 3 x 3 y 2 β 4 x 3 x 4 x 4 x 4 y i = β 0 + β 1 x i 1 + β 2 x i 2 + β 3 x i 3 + β 4 x i 4 + ǫ i ( i = 1 , 2 , . . . , n ) Yves Rosseel lavaan : an R package for structural equation modeling and more 3 / 42 Yves Rosseel lavaan : an R package for structural equation modeling and more 4 / 42

  2. Department of Data Analysis Ghent University Department of Data Analysis Ghent University Path Analysis Structural Equation Modeling • testing models of ‘causal’ relationships among observed variables • path analysis with latent variables • all variables are observed (manifest) y 7 y 8 y 9 y 10 y 11 y 12 • system of regression equations y 1 y 2 η 1 η 3 η 4 x 1 x 5 y 3 x 2 y 4 x 3 y 5 η 2 x 4 x 6 x 7 y 6 Yves Rosseel lavaan : an R package for structural equation modeling and more 5 / 42 Yves Rosseel lavaan : an R package for structural equation modeling and more 6 / 42 Department of Data Analysis Ghent University Department of Data Analysis Ghent University Measurement part only: confirmatory factor analysis (CFA) Classic example CFA • factor analysis: representing the relationship between one or more latent • well-known dataset; based on Holzinger & Swineford (1939) data variables and their (observed) indicators • also analyzed by Jöreskog (1969) y 1 • 9 observed ‘indicators’ measuring three ‘latent’ factors: – a ‘visual’ factor measured by x1, x2 and x3 y 2 η 1 – a ‘textual’ factor measured by x4, x5 and x6 y 3 – a ‘speed’ factor measured by x7, x8 and x9 • N=301 y 4 • we assume the three factors are correlated y 5 η 2 y 6 Yves Rosseel lavaan : an R package for structural equation modeling and more 7 / 42 Yves Rosseel lavaan : an R package for structural equation modeling and more 8 / 42

  3. Department of Data Analysis Ghent University Department of Data Analysis Ghent University Diagram of the model Observed covariance matrix: S • n is the number of observed variables: n = 9 x1 • observed covariance matrix: x2 visual x1 x2 x3 x4 x5 x6 x7 x8 x9 x3 x1 1.36 x2 0.41 1.38 x3 0.58 0.45 1.28 x4 x4 0.51 0.21 0.21 1.35 x5 0.44 0.21 0.11 1.10 1.66 x5 textual x6 0.46 0.25 0.24 0.90 1.01 1.20 x7 0.09 -0.10 0.09 0.22 0.14 0.14 1.18 x8 0.26 0.11 0.21 0.13 0.18 0.17 0.54 1.02 x6 x9 0.46 0.24 0.37 0.24 0.30 0.24 0.37 0.46 1.02 x7 • we want to ‘explain’ the observed correlations/covariances by postulating a number of latent variables (factors) and a corresponding factor structure speed x8 • we will ‘rewrite’ the n ( n + 1) / 2 = 45 elements in the covariance matrix as x9 a function a smaller number of ‘free parameters’ in the CFA model, summa- rized in a number of (typically sparse) matrices Yves Rosseel lavaan : an R package for structural equation modeling and more 9 / 42 Yves Rosseel lavaan : an R package for structural equation modeling and more 10 / 42 Department of Data Analysis Ghent University Department of Data Analysis Ghent University The standard CFA model: matrix representation   • the classic LISREL representation uses three matrices (for CFA) x Ψ =  x x  • the LAMBDA matrix contains the ‘factor structure’: x x x   0 0 • what we can not explain by the set of common factors (the ‘residual part’ of x the model) is written in the (typically diagonal) matrix THETA: 0 0 x     0 0  x    x   0 0  x  x     Λ =  0 0    x    x      0 0 x    x      0 0 x Θ =     x     0 0  x    x   0 0 x   x     x   • the variances/covariances of the latent variables are summarized in the PSI x matrix: • note that we have only 24 parameters (of which 21 are estimable) Yves Rosseel lavaan : an R package for structural equation modeling and more 11 / 42 Yves Rosseel lavaan : an R package for structural equation modeling and more 12 / 42

  4. Department of Data Analysis Ghent University Department of Data Analysis Ghent University Software for SEM (commercial) The standard CFA model: parameter estimation • in the standard CFA model, the ‘implied’ covariance matrix is: The big four Σ = ΛΨΛ ′ + Θ • LISREL • EQS • estimation problem: choose the ‘free’ parameters, so that the estimated im- plied covariance matrix ( ˆ Σ ) is ‘as close as possible’ to the observed covari- • AMOS ance matrix S • MPLUS – generalized (weighted) least-squares estimation Others – maximum likelihood estimation • CALIS/TCALIS (SAS/Stat) • identification: we need to fix the ‘scale’ of the latent variables • SEPATH (Statistica) – for each factor: fix the loading of one indicator to 1.0 – OR: fix the variance of the factors to 1.0 (=standardize the latent vari- • RAMONA (Systat) ables) • . . . Yves Rosseel lavaan : an R package for structural equation modeling and more 13 / 42 Yves Rosseel lavaan : an R package for structural equation modeling and more 14 / 42 Department of Data Analysis Ghent University Department of Data Analysis Ghent University Software for SEM (non-commercial) A short history of LISREL • Mx • 1969: seminal paper by Karl Jöreskog: A General Approach to Confirmatory Maximum Likelihood Factor Analysis , published in Psychometrika • gllamm (Stata) • 1970: Karl Jöreskog wrote the first FORTRAN program for CFA: ACOVS, • . . . later extended to ACOVSM, COFAMM, and eventually LISREL I (1972) • various R packages (sem, OpenMx, lavaan) • 1972: LISREL I (LInear Structural RELationships) + LISREL II • 1976: LISREL III (first commercial version?) • 1978: LISREL IV • 1981: LISREL V • 1984: LISREL VI (as part of SPSS/X) • 1989: LISREL 7 (as part of SPSS/PC) • 1993: LISREL 8 • today: LISREL 8.8 Yves Rosseel lavaan : an R package for structural equation modeling and more 15 / 42 Yves Rosseel lavaan : an R package for structural equation modeling and more 16 / 42

  5. Department of Data Analysis Ghent University Department of Data Analysis Ghent University What is lavaan? Current status of lavaan • lavaan is an R package for latent variable analysis: • 1st public (CRAN) release of lavaan (0.3-1): May 2010 – confirmatory factor analysis: function cfa() • 2nd public (CRAN) release of lavaan (0.4.7): Feb 2011 – structural equation modeling: function sem() • webpage: http://lavaan.org – latent curve analysis / growth modeling: function growth() – documentation: ‘Introduction to lavaan’ (about 25 pages) – (item response theory (IRT) models) – overview of new features/changes, known issues and bugs/glitches – (latent class + mixture models) – development versions – (multilevel models) • the lavaan package is developed to provide useRs, researchers and teach- ers a free, open-source, but commercial-quality package for latent variable modeling • the long-term goal of lavaan is to implement all the state-of-the-art capabil- ities that are currently available in commercial packages Yves Rosseel lavaan : an R package for structural equation modeling and more 17 / 42 Yves Rosseel lavaan : an R package for structural equation modeling and more 18 / 42 Department of Data Analysis Ghent University Department of Data Analysis Ghent University Why do we need lavaan? Related R packages • perhaps the best state-of-the-art software packages in this field are still closed- • sem source and/or commerical: – developer: John Fox (since 2001) – commercial: LISREL, EQS, AMOS, MPLUS – for a long time the only option in R – free, but closed-source: Mx • OpenMx – free, but relying on third-party commercial software: gllamm (stata), – ‘advanced’ structural equation modeling OpenMx (the NPSOL solver) – developed at the University of Virginia (PI: Steven Boker) • it seems unfortunate that new developments in this field are hindered by the – Mx reborn lack of open source software that researchers can use to implement their newest ideas – free, but the solver is (currently) not open-source – http://openmx.psyc.virginia.edu/ • in addition, teaching these techniques to students was often complicated by the forced choice for one of these commercial packages • interfaces between R and commercial packages: – REQS – MplusAutomation Yves Rosseel lavaan : an R package for structural equation modeling and more 19 / 42 Yves Rosseel lavaan : an R package for structural equation modeling and more 20 / 42

Download Presentation
Download Policy: The content available on the website is offered to you 'AS IS' for your personal information and use only. It cannot be commercialized, licensed, or distributed on other websites without prior consent from the author. To download a presentation, simply click this link. If you encounter any difficulties during the download process, it's possible that the publisher has removed the file from their server.

Recommend


More recommend