
SLIDE 1
Data Mining: Introduction Lecture Notes for Chapter 1 Introduction to Data Mining, 2nd Edition
by Tan, Steinbach, Karpatne, Kumar
1 Introduction to Data Mining, 2nd Edition Tan, Steinbach, Karpatne, Kumar 09/09/2020
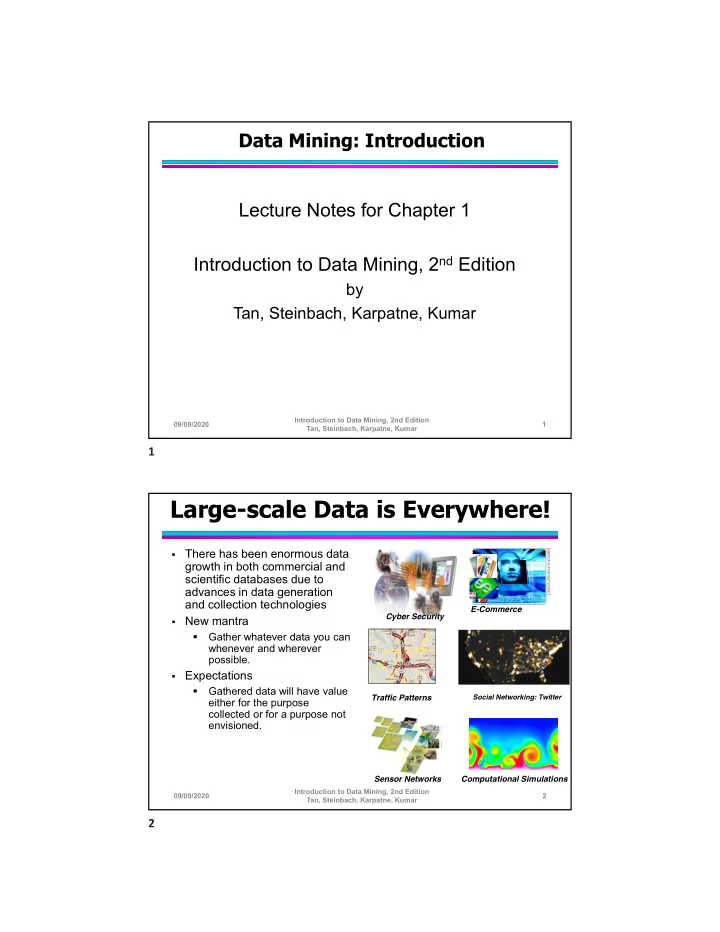
Large-scale Data is Everywhere!
- There has been enormous data
growth in both commercial and scientific databases due to advances in data generation and collection technologies
- New mantra
- Gather whatever data you can
whenever and wherever possible.
- Expectations
- Gathered data will have value
either for the purpose collected or for a purpose not envisioned.
Computational Simulations
Social Networking: Twitter
Sensor Networks Traffic Patterns Cyber Security
Introduction to Data Mining, 2nd Edition Tan, Steinbach, Karpatne, Kumar 2 09/09/2020
E-Commerce