
SLIDE 1
03/03/2014 Products Solutions Services
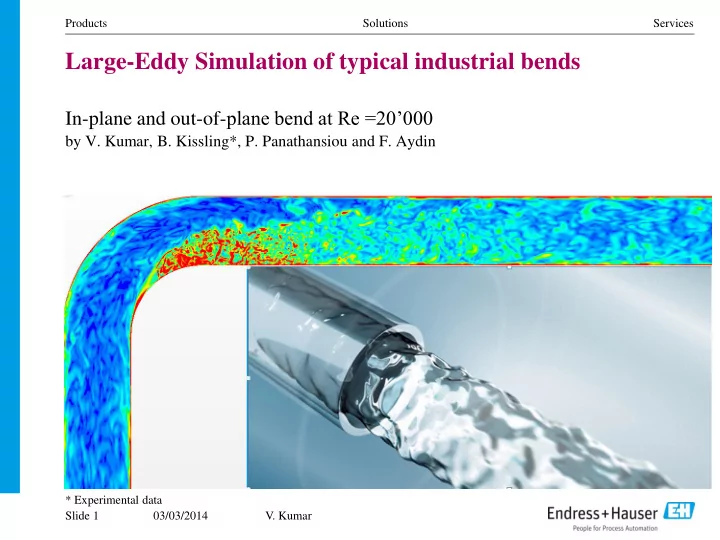
Large-Eddy Simulation of typical industrial bends
In-plane and out-of-plane bend at Re =20’000
by V. Kumar, B. Kissling*, P. Panathansiou and F. Aydin
* Experimental data Slide 1
- V. Kumar