Landslide hazard and risk zonationwhy C.J. van Westen T.W.J. van - PDF document
Bull Eng Geol Env (2005) ORIGINAL PAPER DOI 10.1007/s10064-005-0023-0 Landslide hazard and risk zonationwhy C.J. van Westen T.W.J. van Asch is it still so difficult? R. Soeters of land use and climatic change Abstract The quantification
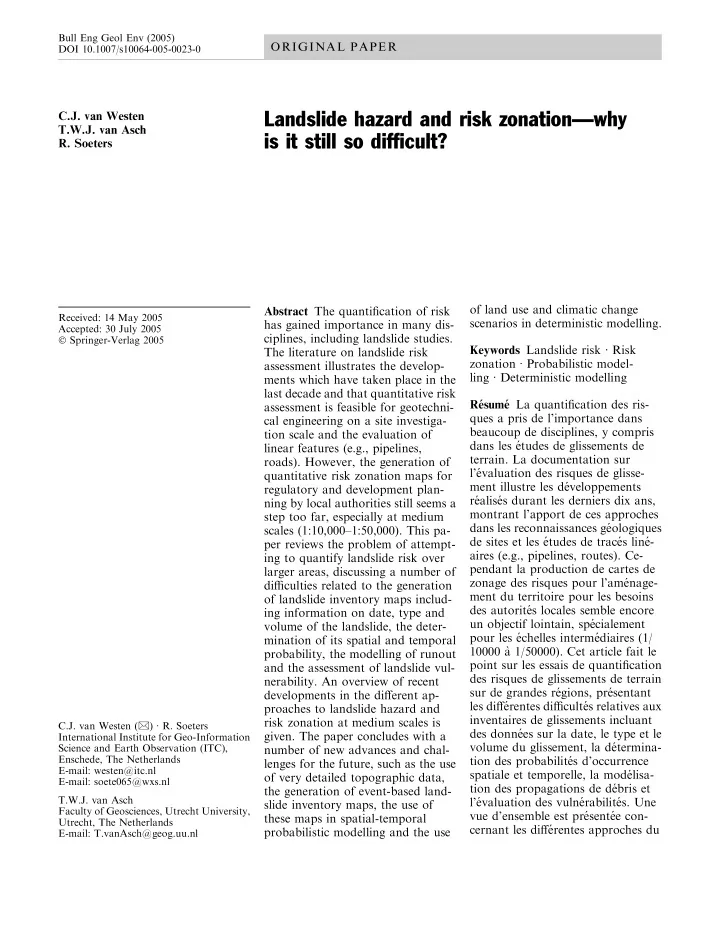
Bull Eng Geol Env (2005) ORIGINAL PAPER DOI 10.1007/s10064-005-0023-0 Landslide hazard and risk zonation—why C.J. van Westen T.W.J. van Asch is it still so difficult? R. Soeters of land use and climatic change Abstract The quantification of risk Received: 14 May 2005 scenarios in deterministic modelling. has gained importance in many dis- Accepted: 30 July 2005 ciplines, including landslide studies. � Springer-Verlag 2005 Keywords Landslide risk Æ Risk The literature on landslide risk zonation Æ Probabilistic model- assessment illustrates the develop- ling Æ Deterministic modelling ments which have taken place in the last decade and that quantitative risk Re ´ sume ´ La quantification des ris- assessment is feasible for geotechni- ques a pris de l’importance dans cal engineering on a site investiga- beaucoup de disciplines, y compris tion scale and the evaluation of dans les e ´ tudes de glissements de linear features (e.g., pipelines, terrain. La documentation sur roads). However, the generation of l’e ´ valuation des risques de glisse- quantitative risk zonation maps for ment illustre les de ´ veloppements regulatory and development plan- re ´ alise ´ s durant les derniers dix ans, ning by local authorities still seems a montrant l’apport de ces approches step too far, especially at medium dans les reconnaissances ge ´ ologiques scales (1:10,000–1:50,000). This pa- de sites et les e ´ tudes de trace ´ s line ´ - per reviews the problem of attempt- aires (e.g., pipelines, routes). Ce- ing to quantify landslide risk over pendant la production de cartes de larger areas, discussing a number of zonage des risques pour l’ame ´ nage- difficulties related to the generation ment du territoire pour les besoins of landslide inventory maps includ- des autorite ´ s locales semble encore ing information on date, type and un objectif lointain, spe ´ cialement volume of the landslide, the deter- pour les e ´ chelles interme ´ diaires (1/ mination of its spatial and temporal 10000 a ` 1/50000). Cet article fait le probability, the modelling of runout point sur les essais de quantification and the assessment of landslide vul- des risques de glissements de terrain nerability. An overview of recent sur de grandes re ´ gions, pre ´ sentant developments in the different ap- les diffe ´ rentes difficulte ´ s relatives aux proaches to landslide hazard and inventaires de glissements incluant risk zonation at medium scales is C.J. van Westen ( & ) Æ R. Soeters des donne ´ es sur la date, le type et le given. The paper concludes with a International Institute for Geo-Information volume du glissement, la de ´ termina- Science and Earth Observation (ITC), number of new advances and chal- Enschede, The Netherlands tion des probabilite ´ s d’occurrence lenges for the future, such as the use E-mail: westen@itc.nl spatiale et temporelle, la mode ´ lisa- of very detailed topographic data, E-mail: soete065@wxs.nl tion des propagations de de ´ bris et the generation of event-based land- T.W.J. van Asch l’e ´ valuation des vulne ´ rabilite ´ s. Une slide inventory maps, the use of Faculty of Geosciences, Utrecht University, vue d’ensemble est pre ´ sente ´ e con- these maps in spatial-temporal Utrecht, The Netherlands cernant les diffe ´ rentes approches du probabilistic modelling and the use E-mail: T.vanAsch@geog.uu.nl
CJ. van Westen et al. zonage des risques de glissements de glissements, l’utilisation de ce type Mots cle ´ s Risque de glissement de terrain aux e ´ chelles moyennes. de cartes dans les mode ´ lisations terrain Æ Zonage de risque Æ L’article conclut avec diverses a- probabilistes et la prise en compte de Mode ´ lisation probabiliste Æ vance ´ es re ´ centes et de ´ fis pour le fu- sce ´ narios relatifs a ` l’ame ´ nagement Mode ´ lisation de ´ terministe tur, tels que l’utilisation de cartes du territoire et aux changements topographiques tre ` s de ´ taille ´ es, la climatiques dans les mode ´ lisations production de cartes d’inventaires de de ´ terministes. abilities, and the corresponding losses, which forms the What is landslide risk? basis for the phases of risk reduction, risk transfer and preparedness planning (Lee and Jones 2004). One of the most useful definitions of risk is presented by The risk formula looks deceptively simple, but when Varnes (1984) as ‘‘the expected number of lives lost, one tries to work it out for a particular situation, such as persons injured, damage to property and disruption of for the specific risk to buildings or persons in buildings economic activity due to a particular damaging phe- (see Fig. 1) the formula quickly turns out to be very nomenon for a given area and reference period’’. When complicated and a lot of aspects should be taken into dealing with physical losses, (specific) risk can be quan- account which are difficult to evaluate. Figure 1 is a tified as the product of vulnerability, cost or amount of typical site investigation situation in great detail to the elements at risk and the probability of occurrence of highlight the complexity of the system. the event with a given magnitude/intensity. When we want to upscale the example illustrated in When we look at the total risk, the hazard is multi- Fig. 1 to a map and carry out a risk zonation for larger plied with the expected losses for all different types of areas, it is very difficult to locate exactly the element at elements at risk (= vulnerability · amount), and this is risk versus the possible locations of the landslides. The done for all landslide types. Schematically, this can be use of the formula requires the analysis of the spatial represented by the following formula, based on Varnes and temporal probabilities that groups of elements at (1984), Fell (1994), Leroi (1996) and Lee and Jones risk in the map are hit by mass movements of different (2004): particular magnitudes, which are then used to estimate � � the degree of loss. X X Risk = ð VA Þ ð 1 Þ H A schematic overview of the procedure for a GIS- based landslide risk assessment at a large or medium where: mapping scale (e.g., 1:10,000–50,000) is given in Fig. 2. H Hazard expressed as probability of occurrence The top of the flowchart displays the four basic types of within a reference period (e.g., year, design input data required: environmental factors, triggering period of a building). Hazard is a function of factors, historic landslide occurrences and elements at the spatial probability (related to static envi- risk. ronmental factors such as slope, strength of Of these types of input data, the historic information materials, depth, etc.) and the temporal prob- on landslide occurrences is by far the most important, as ability , related indirectly to some static envi- it gives insight into the frequency of the phenomena, the ronmental factors like slope and hydraulic types involved, the volumes and the damage that has conductivity and directly to dynamic factors been caused. Landslide inventory maps, derived from like rain input and drainage historic archives, field data collection, interviews and V Physical vulnerability of a particular type of image interpretation are essential but unfortunately of- element at risk (from 0 to 1) for a specific type ten lacking which makes a quantitative risk assessment of hazard and for a specific element at risk very difficult. A Amount or cost of the particular elements at Information on triggering factors consists of earth- risk (e.g., number of buildings, cost of build- quake and rainfall records, which have to be converted ings, number of people, etc.) into magnitude–frequency relations of those aspects that The calculation of the consequences ( VA ) has to be actually trigger landslides, e.g., earthquake acceleration done for all elements at risk, and the results added for or groundwater depth. These parameters are very site one particular landslide hazard (the probability for a specific and can only be modelled properly using deter- specific combination of landslide type and magnitude). ministic (geotechnical or hydrological) models, which The specific risk would result in a single value of po- require considerable input on the geotechnical charac- tential losses for a given probability. Theoretically, the terization of the terrain (soil depth, cohesion, friction formula would result in a so-called risk curve, contain- angle, permeability). ing the relation between all events with different prob-
Landslide hazard and risk zonation Fig. 1 Example of possible cal- culation methods for specific risk to buildings and persons in buildings Determining temporal probability is done either by and a set of environmental factors, in order to predict correlating the data on landslide occurrences with those areas of landslide initiation that have similar combina- of the triggering factors (provided that the historical tions of factors, using heuristic or statistical methods. records are sufficient for this) or through dynamic The spatial information on landslide initiation locations modelling (Van Beek 2002). is used in combination with the environmental factors, The spatial probability can be obtained either of which the Digital Elevation Model (DEM) is the through dynamic modelling or through analysing the most crucial one, in the modelling of the runout distance relation between the locations of past landslide events for landslides of a particular type and volume. The Fig. 2 Schematic representa- tion of spatial landslide risk assessment methodology
Recommend
More recommend
Explore More Topics
Stay informed with curated content and fresh updates.
