
SLIDE 1
La Lake Mead Pro rotection Actions
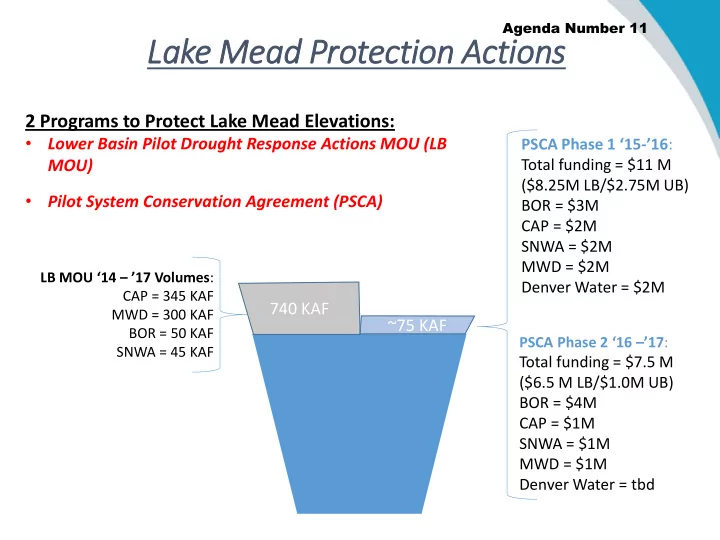
2 Programs to Protect Lake Mead Elevations:
- Lower Basin Pilot Drought Response Actions MOU (LB
MOU)
- Pilot System Conservation Agreement (PSCA)
740 KAF ~75 KAF
PSCA Phase 1 ‘15-’16: Total funding = $11 M ($8.25M LB/$2.75M UB) BOR = $3M CAP = $2M SNWA = $2M MWD = $2M Denver Water = $2M
LB MOU ‘14 – ’17 Volumes: CAP = 345 KAF MWD = 300 KAF BOR = 50 KAF SNWA = 45 KAF PSCA Phase 2 ‘16 –’17:
Total funding = $7.5 M ($6.5 M LB/$1.0M UB) BOR = $4M CAP = $1M SNWA = $1M MWD = $1M Denver Water = tbd
Agenda Number 11