Key Performance Indicators Proposed FY 2017 FY 2016 2016 YTD - - PowerPoint PPT Presentation

key performance indicators
SMART_READER_LITE
LIVE PREVIEW

Key Performance Indicators Proposed FY 2017 FY 2016 2016 YTD - - PowerPoint PPT Presentation

Key Performance Indicators Proposed FY 2017 FY 2016 2016 YTD KPI CRITERIA FY 2017 TARGET TARGET (Aug) Ridership Bus Passengers per Greater than or Greater than or equal to Bus 21.8 Productivity Revenue Hour equal to 23.8


slide-1
SLIDE 1

Key Performance Indicators

Proposed – FY 2017

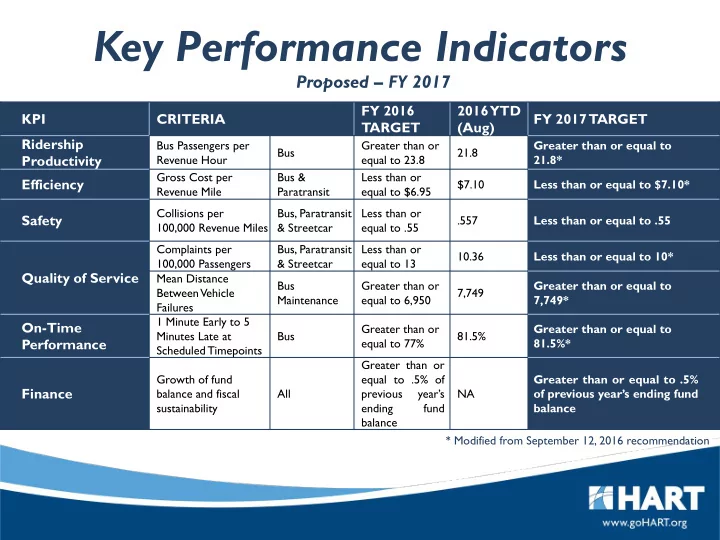
KPI CRITERIA FY 2016 TARGET 2016 YTD (Aug) FY 2017 TARGET Ridership Productivity

Bus Passengers per Revenue Hour Bus Greater than or equal to 23.8 21.8 Greater than or equal to 21.8*

Efficiency

Gross Cost per Revenue Mile Bus & Paratransit Less than or equal to $6.95 $7.10 Less than or equal to $7.10*

Safety

Collisions per 100,000 Revenue Miles Bus, Paratransit & Streetcar Less than or equal to .55 .557 Less than or equal to .55

Quality of Service

Complaints per 100,000 Passengers Bus, Paratransit & Streetcar Less than or equal to 13 10.36 Less than or equal to 10* Mean Distance Between Vehicle Failures Bus Maintenance Greater than or equal to 6,950 7,749 Greater than or equal to 7,749*

On-Time Performance

1 Minute Early to 5 Minutes Late at Scheduled Timepoints Bus Greater than or equal to 77% 81.5% Greater than or equal to 81.5%*

Finance

Growth of fund balance and fiscal sustainability All Greater than or equal to .5% of previous year’s ending fund balance NA Greater than or equal to .5%

  • f previous year’s ending fund

balance * Modified from September 12, 2016 recommendation

slide-2
SLIDE 2

Ridership Productivity

METRIC: BUS PASSENGERS PER REVENUE HOUR

DESCRIPTION: This measures total fixed route bus ridership, divided by total fixed route bus revenue service

  • hours. Ridership and revenue service hours are data reported to the National Transit Database and

reported data is validated about 14-18 months from close of fiscal year.

PROPOSED FY 17 GOAL: GREATER THAN OR EQUAL TO 21.8

PASSENGERS PER REVENUE HOUR - FL

15 20 25 30 35 40 2008 2009 2010 2011 2012 2013 2014 2015 2016

BUS PASSENGERS PER REVENUE HOUR

GOAL ACTUAL

Miami Broward Palm Beach LYNX PSTA JTA

21.8 YTD (Aug) 23.8 Goal (2016)

slide-3
SLIDE 3

Efficiency

METRIC: GROSS COST PER REVENUE MILE

DESCRIPTION: This measures the ratio of gross operating cost to total revenue miles for fixed route revenue bus and paratransit service (excludes reserves). Total operating cost and revenue miles are data reported to the National Transit Database and reported data is validated about 14-18 months from close of fiscal year.

PROPOSED FY 17 GOAL: LESS THAN OR EQUAL TO $7.10

FAREBOX RECOVERY - FL

$5.00 $6.00 $7.00 $8.00 2008 2009 2010 2011 2012 2013 2014 2015 2016

GROSS COST PER REVENUE MILE

GOAL ACTUAL

$7.10 YTD (Aug) $6.95 Goal (2016)

slide-4
SLIDE 4

Safety

METRIC: COLLISIONS PER 100,000 REVENUE MILES

DESCRIPTION: This measures the ratio of collisions (as reported to the National Transit Database) for all modes (bus, paratransit and streetcar) per 100,000 revenue service miles. Collisions and revenue miles are data reported to the National Transit Database and reported data is validated about 14-18 months from close of fiscal year.

PROPOSED FY 17 GOAL: LESS THAN OR EQUAL TO .55

0.20 0.40 0.60 2008 2009 2010 2011 2012 2013 2014 2015 2016

COLLISIONS PER 100,000 REVENUE MILES

GOAL ACTUAL

.557 YTD (Aug) .55 Goal (2016)

slide-5
SLIDE 5

Quality of Service

METRIC: COMPLAINTS PER 100,000 PASSENGERS

DESCRIPTION: This measures the ratio of customer service complaints per 100,000 passenger rides on all modes

PROPOSED FY 17 GOAL: LESS THAN OR EQUAL TO 10

5.00 7.00 9.00 11.00 13.00 2008 2009 2010 2011 2012 2013 2014 2015 2016

COMPLAINTS PER 100,000 PASSENGERS

GOAL ACTUAL

10.36 YTD (Aug) 13.00 Goal (2016)

slide-6
SLIDE 6

Quality of Service

METRIC: MEAN DISTANCE BETWEEN FAILURES

DESCRIPTION: This measures the miles between mechanical failures on the fixed route fleet which, for safety reasons, requires that a bus be removed from service preventing it from completing its daily scheduled revenue service.

PROPOSED FY 17 GOAL: LESS THAN OR EQUAL TO 7,749

FLEET AGE - HART

4,000 6,000 8,000 10,000 2010 2011 2012 2013 2014 2015 2016

MEAN DISTANCE BETWEEN FAILURES

GOAL ACTUAL

7,749 YTD (Aug) 6,950 Goal (2016)

slide-7
SLIDE 7

On-Time Performance

METRIC: ON-TIME BUS ARRIVAL AT SCHEDULED TIMEPOINTS

DESCRIPTION: This measures on-time performance of fixed route bus service. On-time is defined as bus arrival at the stop between one minute early and five minutes late. All timepoints are verified with HART’s Computer-Aided Dispatch/Automatic Vehicle Location (CAD/AVL) system.

PROPOSED FY 17 GOAL: GREATERTHAN OR EQUAL TO 81.5%

60.0% 70.0% 80.0% 90.0% 2011 2012 2013 2014 2015 2016

ON-TIME PERFORMANCE

GOAL ACTUAL

81.5% YTD (Aug) 77% Goal (2016)

slide-8
SLIDE 8

System 2014 riders 2014 revenue hrs 2014 riders/hr 2015 riders 2015 revenue hrs 15 riders/hr Miami-Dade Transit 109,674,441 3,008,768

36.45

105,198,299 2,991,108

35.17

Broward County Transit 40,825,445 1,246,868

32.74

39,759,952 1,295,982

30.68

LYNX Transit 29,367,232 1,166,185

25.18

28,858,525 1,202,978

23.99

Hillsborough Area Regional Transit 14,966,368 618,305

24.20

14,999,878 627,992

23.74

Pinellas Suncoast Transit Authority 14,184,320 641,039

22.13

14,578,488 651,199

22.39

Jacksonville Transportation Authority 12,225,824 625,343

19.55

12,950,091 633,352

20.45

Palm Beach County Transportation Agency 11,426,791 431,696

26.47

10,773,438 481,081

22.39

Gainesville Regional Transit System 10,814,433 298,200

36.27

10,251,248 302,943

33.84

  • S. Florida Regional Transportation

Authority 5,402,035 174,894

30.89

5,363,719 180,337

29.74

Lee County Transit 3,985,691 187,143

21.30

3,759,763 196,082

19.17

Source: CUTR

PASSENGER TRIPS PER REVENUE HOUR Top Ten Florida Transit Systems (by ridership)

slide-9
SLIDE 9

Mission, Vision, Core Values & Goals

VISION STATEMENT GOALS

Our vision is to make transit a relevant and viable travel option for residents within HART’s service area.

1. Exceed Customer Expectations 2. Ensure Safety & Security 3. Maximize Financial Well- Being 4. Foster a Thriving Internal Environment 5. Enhance Connections Within the County and Region 6. Embrace Innovative Practices and Systems

MISSION STATEMENT

The mission of the Hillsborough Transit Authority (HART) is to provide safe, innovative and cost-effective public transportation services that enhance the quality of life in our community.

CORE VALUES

  • Open & Effective Communication
  • Teamwork & Diversity
  • Leadership & Accountability
  • Integrity, Trust & Professionalism
  • Fiscal Responsibility
  • Excellence, Innovation & Development
  • Safety Promotion at All Levels
  • Community Driven

Approved by the HART Board March 5, 2012