
SLIDE 1
Joint Legislative Transportation Oversight Storm Impact on NCDOT - - PowerPoint PPT Presentation
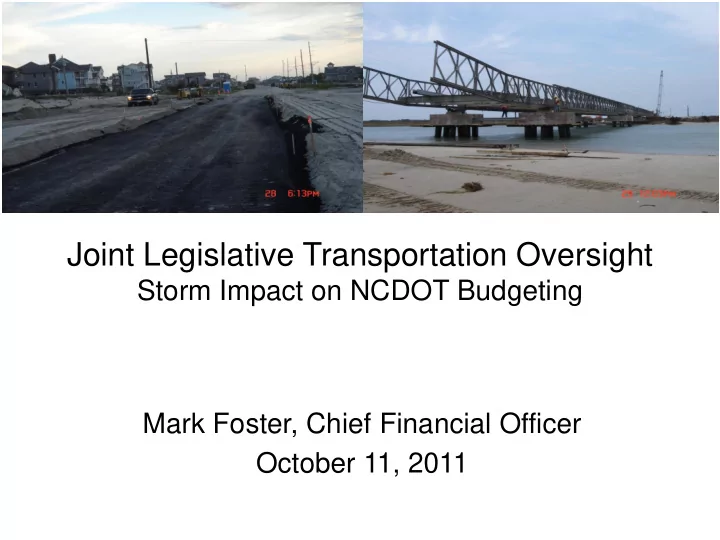
Joint Legislative Transportation Oversight Storm Impact on NCDOT Budgeting Mark Foster, Chief Financial Officer October 11, 2011 Emergency Relief Programs Administered by the Federal Emergency Management Agency (FEMA) & Federal
Federal Highway Administration (FHWA)
– Natural Disasters (i.e. hurricanes, tornadoes, wild fires, severe storms) – Catastrophic Failures (i.e. bridge collapses after being struck by a barge)
emergency efforts
– FEMA Reimburses States/Locals for repairs to non Federal-Aid Roads & Bridges – FHWA Reimburses NCDOT for repairs to Federal-Aid Roads & Bridges
2
– File for reimbursement with supporting cost detail data – May take years before NCDOT is fully reimbursed
– Charged to Maintenance – 1st coverage is unallocated maintenance reserve
3
FHWA
Federal review & authorization
incurs cost first and then may seek reimbursement
criteria – $700,000 minimum in FHWA
damages statewide – $5,000 minimum per site – $100 million per state cap
FEMA
Federal review & authorization
incurs cost first and then may seek reimbursement
criteria – $12.5 million minimum damages statewide
– $1,000 minimum per site
Division of Emergency Management
4
FHWA
eligible cost determination
– 90% Interstates – 80% other eligible roadways
Date of Declaration is critical FEMA
approval determines eligibility
are an allowable cost
5
6
Declared Federal Disasters $ in Millions Total Cost Federal Reimbursement State Funding Largest Events Hurricanes $ 380.9 $ 287.9 $ 93.0 Fran $119 M Ice Storms 142.6 79.3 63.2 Dec 2002 $67 M Floods/Tornadoes/Other 27.9 25.7 2.3 Haywood Co Rockslide $15 M Total $ 551.4 $ 392.9 $ 158.5 Percent (%) 71% 29% Avg/Year $ 36.8 $ 26.2 $ 10.6 Non-Declared Disasters $ in Millions Total Cost Federal Reimbursement State Funding Snow and Ice $ 430.5 $ 430.5 Avg/Year $ 28.7 $ 28.7
7
Disaster Event Date Estimated Cost Federal Reimbursed State Maint. Funding State Matching Receivable Balance
Hurricane Irene Aug-11 30,000,000 $
30,000,000 Hurricane Earl Sep-10 478,427 11,792 23,050 443,584
Sep-10 3,000,913 3,000,913 TS Ida Nov-09 1,459,619 1,435,754 23,865
Sep-08 2,346,690 1,052,857 1,293,833
Aug-06 4,976,397 1,352,072 3,553,892 70,433
Sep-05 3,163,144 2,043,814 806,785 312,545
Aug-05 58,777 53,497 5,280
Sep-04 61,471,452 49,687,748 11,245,970 537,734
Sep-04 16,349,407 12,083,960 4,265,447
Aug-04 1,284,435
Aug-04 308,849 308,849
Sep-03 39,831,780 29,789,477 8,476,377 1,565,927
Sep-99 88,946,161 56,005,889 31,314,931 1,625,341
Aug-99 2,925,193 1,514,748 1,240,277 170,168
Aug-98 5,653,800 3,150,963 2,473,150 29,686
Sep-96 118,694,526 96,777,659 20,909,111 1,007,755
380,949,568 $ 254,960,229 $ 85,902,273 $ 7,086,152 $ 33,000,913
Jan-11 15,543,876
Dec-09 14,000,000 4,605,843 9,394,157
Feb-03 12,789,210 10,626,658 2,061,030 101,522
Dec-02 67,265,183 44,726,953 21,299,329 1,238,901
Jan-00 21,141,858 5,548,129 15,584,466 9,263
Jan-98 11,844,239 4,419,969 7,269,082 155,188
142,584,366 $ 69,927,551 $ 61,757,783 $ 1,504,874 $ 9,394,157 April 2011 Tornado Apr-11 8,150,800 66,414 8,084,386 Harnett Co. Tornado Apr-11 9,606 9,606
May-09 152,443 152,443
Oct-09 15,321,061 14,764,399
Nov-08 238,283 185,296 52,986
May-08 401,457 367,788 33,669
Nov-06 2,988,062 2,448,238 39,774 500,050
Oct-05 342,232 342,232
2008 & 2011 316,305 225,592
Total Other 27,920,248 $ 17,504,643 $ 745,301 $ 1,495,206 $ 8,175,098 Total All Events 551,454,182 $ 342,392,424 $ 148,405,357 $ 10,086,232 $ 50,570,168 Percent (%) 71.0% 27.0% 2.0% $ AVG/Year $36.8 $26.2 $9.8 $.8
($49.9M FHWA & $111M FEMA reimbursement outstanding)
and increased Federal share of cost
type of work (ie: Debris Removal, Emergency Protective Measures, Snow Removal, Vessel & Equipment Relocation, Signs and Signals)
8
NCDOT Reserves Primary & Secondary Maintenance Funds:
9
(Costs in $ Millions)
Funds Allocated Funds Expended FY2010 Snow & Ice Removal $ 60 $ 64 FY2011 Snow & Ice Removal $ 40 $ 49 FY2012 Snow & Ice Removal $ 50 Note1: Historical average snow & ice cost = $30 million
10
NCDOT Budgeting Process:
– Cost primarily Federally Reimbursed (71%) – FHWA or FEMA participation in cost is determined by type of event, location, severity of damage, & work activity required to respond appropriately – NCDOT pays first & requests reimbursement as federal $’s become available – Settlement with maintenance & Trust Fund budget occurs after final FHWA/FEMA reimbursement – Cash Model reserves $10 M annually for disasters - coincides with $10 M historical average/year
– Historical annual cost - $30 M – Last 2 years average $57 M – Approximately 10% ($50M) of SFY 2012 Maintenance Budget is allocated statewide for this purpose – Additional $10 M unallocated to divisions until 3rd quarter to meet an unforseen event to minimize the impact to standard operations
11
12
13
Disaster Event Date Cost Estimate FEMA % FHWA % State Maint. % State Trust Funds %
Hurricane Irene *
Aug-11
30.0 NA NA NA NA Hurricane Ivan
Sep-04
61.4 33% 48% 18%
1%
Hurricane Frances
Sep-04
15.9 58% 14% 27%
0%
Hurricane Isabel
Sep-03
39.9 26% 49% 21%
4%
Hurricane Floyd
Sep-99
89.0 28% 36% 35%
2%
Hurrican Fran
Sep-96
118.6 58% 23% 18%
1%
Haywood Co. Rockslide
Oct-09
15.3 0% 97% 0%
3%
Jan-11
15.5 0% 0% 100%
0%
Feb-03
12.8 59% 23% 16%
1%
Dec-02
67.2 40% 27% 32%
2%
Jan-00
21.3 8% 18% 73%
0%
Winter Storm 2009
Jan-09
14.0 100% 0% 0%
0%
Jan-98
11.8 25% 11% 62%
2% Total
512.7 $ 42% 34% 29% 1%
Other Disasters
38.7 $
Grand Total
551.4 $ * Note: Hurricane Irene cost estimate is preliminary and does not include the cost of the permanent NC 12 bridge structure.
14
1997
$11,051,274.95
1998
$11,400,644.75
1999
$16,262,769.61
2000
$25,563,556.35
2001
$21,738,417.83
2002
$19,631,666.50
2003
$32,453,052.55
2004
$44,939,518.76
2005
$26,469,883.95
2006
$25,983,698.36
2007
$22,000,395.53
2008
$24,705,362.08
2009
$29,500,000.00
2010
$66,400,000.00
2011
$52,400,000.00
Total
$430,500,241.22
15