SLIDE 1
http://aqualab.cs.northwestern.edu
John S. Otto, Mario A. Sanchez, David R. Choffnes*, Fabián E. Bustamante, Georgos Siganos**
Northwestern, EECS * U. Wash, CSE ** Telefónica Research
SLIDE 2
Otto, Sánchez, Choffnes, Bustamante & Siganos
2
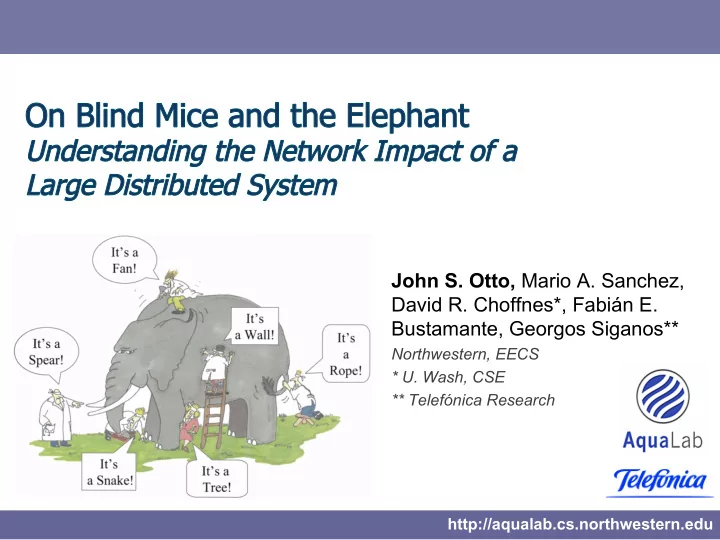
On Blind Mice and the Elephant
SLIDE 3 Otto, Sánchez, Choffnes, Bustamante & Siganos
3
- A large, global peer-to-peer system
- Millions of users exchanging content
- Virtually every country in the world
On Blind Mice and the Elephant
SLIDE 4
Otto, Sánchez, Choffnes, Bustamante & Siganos
4
System’s measured network impact depends on
measurement vantage point
– How much of network traffic is from BitTorrent?
On Blind Mice and the Elephant
Eastern Europe 57% (ipoque) South America 20% (ipoque) No, Germany is 9-15% (Maier et al. IMC’09) Germany 37% (ipoque)
SLIDE 5 Otto, Sánchez, Choffnes, Bustamante & Siganos
5
A view from a broad set of end users
– To sample its overall network traffic – Understand where it flows – Who pays for it (and how expensive it is)
This work
– Relies on end users as vantage points
- Captures a sample of all BitTorrent traffic
- Reveals traffic’s path through the network
– Public view is not sufficient to map most BitTorrent traffic
– ISP data provides context to understand cost of BitTorrent traffic
On Blind Mice and the Elephant
SLIDE 6 Otto, Sánchez, Choffnes, Bustamante & Siganos
6
Representative sample of users
– 500,000 users, 3,300 networks, 169 countries
Running extensions (Ono & NEWS) for Vuze
BitTorrent client
– Anonymously report statistics – Provide application-level data
- e.g. session length, per-connection transfer volumes
- Log 13 TB of traffic per day
– Conduct active measurements to reveal traffic paths
- With public view alone, we can map 25% of traffic
- Supplemented with traceroutes, we can map 89%
On Blind Mice and the Elephant
SLIDE 7
Otto, Sánchez, Choffnes, Bustamante & Siganos
7
How BitTorrent is being used
– Who is using BitTorrent? – When do people run BitTorrent? – How much traffic does it generate? – Study data from Nov. 2008 to Nov. 2010
Where the generated traffic flows Who pays for it and how much
On Blind Mice and the Elephant
SLIDE 8 Otto, Sánchez, Choffnes, Bustamante & Siganos
8
On Blind Mice and the Elephant
EU 52% NA 20% AS 19% SA 4% OC 3% AF 2% EU 61% NA 19% AS 13% SA 4% OC 2% AF 1%
2009 2010
- Decrease in Europe
- Increase in Asia, Africa and Oceania
Connected peers by continent
- Overall population reduced by 10%
- Locations of users change over time
SLIDE 9 Otto, Sánchez, Choffnes, Bustamante & Siganos
9
On Blind Mice and the Elephant
Rate of growth of connected users per continent relative to
- Nov. 2008
- Europe continues to drop
- N. America, S. America remain stable since 2009
- 76% growth in Africa and 47% in Asia
SLIDE 10 Otto, Sánchez, Choffnes, Bustamante & Siganos
10
06 08 10 12 14 16 18 20 22 00 02 04 06 20 40 60 80 100 Normalized % of hourly peers seen
2009
- Shift away from overnight use
- Peak usage aligns with evening hours, local time
– Potential impact on ISPs’ costs under burstable billing
On Blind Mice and the Elephant
European peers seen on weekdays
Normalized number
hour in Europe, depending on time
SLIDE 11 Otto, Sánchez, Choffnes, Bustamante & Siganos
11
06 08 10 12 14 16 18 20 22 00 02 04 06 20 40 60 80 100 Normalized % of hourly peers seen
2009
- Shift away from overnight use
- Peak usage aligns with evening hours, local time
– Potential impact on ISPs’ costs under burstable billing
On Blind Mice and the Elephant
European peers seen on weekdays
Normalized number
hour in Europe, depending on time
06 08 10 12 14 16 18 20 22 00 02 04 06 20 40 60 80 100 Normalized % of hourly peers seen
2009 2010
SLIDE 12 Otto, Sánchez, Choffnes, Bustamante & Siganos
12
- 25% increase in per-peer hourly download volume
- Despite a 20% drop in total connections,
a 12% increase in overall system traffic
On Blind Mice and the Elephant
Nov ’09 Jan ’10 Mar ’10 May ’10 Jul ’10 Sep ’10 Nov ’10 20 40 60 80 100 120 140 160 Hourly Peer Download Volume (MB)
Per-peer hourly download volume (in MB) over the last year
SLIDE 13
Otto, Sánchez, Choffnes, Bustamante & Siganos
13
Overall population reduced by 10%
– But large increase in Africa and Asia
Peak usage aligns with evening hours 12% increase in overall system traffic
– 25% increase in per-peer hourly download volume
So where’s the traffic?
On Blind Mice and the Elephant
SLIDE 14
Otto, Sánchez, Choffnes, Bustamante & Siganos
14
How “deep” does traffic go in the network? Who is paying for it? Traffic path analysis to see which networks carry
most BitTorrent traffic
– Tier 1: Well-known networks – Tier 2: Large transit providers – Tier 3: Small transit providers – Tier 4: Content/access/hosting providers Enterprise customers
On Blind Mice and the Elephant
Tiers based on Dhamdhere and Dovrolis, IMC 2008
SLIDE 15 Otto, Sánchez, Choffnes, Bustamante & Siganos
15
0.1 0.2 0.3 0.4 0.5 0.6 0.7 0.8 0.9 1 0.1 0.2 0.3 0.4 0.5 0.6 0.7 0.8 0.9 1 CDF [X ≤ x] Proportion of Traffic
- Most traffic stays at or below Tier 3
- Significant fraction of traffic never reaches Tiers 1 or 2
– Typically missed by in-network monitoring studies from the core
On Blind Mice and the Elephant
Fraction of each peer’s traffic that reaches Tier X
Smaller fraction
Tier 1 Tier 2 Tier 3 Tier 4
SLIDE 16 Otto, Sánchez, Choffnes, Bustamante & Siganos
16
- Most traffic stays at or below Tier 3
- Significant fraction of traffic never reaches Tiers 1 or 2
– Typically missed by in-network monitoring studies from the core
On Blind Mice and the Elephant 0.1 0.2 0.3 0.4 0.5 0.6 0.7 0.8 0.9 1 0.1 0.2 0.3 0.4 0.5 0.6 0.7 0.8 0.9 1 CDF [X ≤ x] Proportion of Traffic
Fraction of each peer’s traffic that reaches Tier X
Tier 1 Tier 2 Tier 3 Tier 4
SLIDE 17 Otto, Sánchez, Choffnes, Bustamante & Siganos
17
- Traffic generally stays in the originating tier
- Tier 2 networks do not provide “intermediate” level of
connectivity between Tiers 1 & 3
On Blind Mice and the Elephant
0.1 0.2 0.3 0.4 0.5 0.6 0.7 0.8 0.9 1 0.1 0.2 0.3 0.4 0.5 0.6 0.7 0.8 0.9 1 Proportion of Traffic Tier 1 Tier 2 Tier 3
Traffic from Tier 2 to Tier 2 Traffic from Tier 3 to Tier 3
0.1 0.2 0.3 0.4 0.5 0.6 0.7 0.8 0.9 1 0.1 0.2 0.3 0.4 0.5 0.6 0.7 0.8 0.9 1 CDF [X ≤ x] Proportion of Traffic Tier 1 Tier 2
SLIDE 18
Otto, Sánchez, Choffnes, Bustamante & Siganos
18
How BitTorrent is being used Where the generated traffic flows
– Most traffic is handled at or below Tier 3
Who pays for it and how much
On Blind Mice and the Elephant
SLIDE 19 Otto, Sánchez, Choffnes, Bustamante & Siganos
19
Determine BitTorrent cost relative to other traffic
– ISP X’s data provides context to interpret traffic sample
Study at granularity of individual network links Consider common burstable billing model
– e.g. 95th-percentile billing
Data for several
- f ISP X’s links
- ver 1 week
On Blind Mice and the Elephant
ISP X ISP A ISP B ISP C ISP G
Providers
Customers
SLIDE 20 Otto, Sánchez, Choffnes, Bustamante & Siganos
20
- Aggregate link volume for each 5 minute bin
- Cost is based on 95th-percentile bin’s value
- Under burstable billing model, not all bytes may have the
same cost
– Peak-hour bytes are more expensive than off-peak
On Blind Mice and the Elephant
95th-percentile value When value is defined All Traffic
SLIDE 21 Otto, Sánchez, Choffnes, Bustamante & Siganos
21
On Blind Mice and the Elephant
Other BT Other BT
- BitTorrent at peak hour is more expensive
- Use Shapley value to determine relative cost of BitTorrent
– Shapley value gives the cost contribution of BitTorrent traffic – Compare to other traffic on the network – Is BitTorrent’s cost more than its “fair share” by volume?
BitTorrent peaks at 3AM BitTorrent peaks at 9PM
SLIDE 22 Otto, Sánchez, Choffnes, Bustamante & Siganos
22
On Blind Mice and the Elephant
Other BT Other BT
- BitTorrent at peak hour is more expensive
- Use Shapley value to determine relative cost of BitTorrent
– Shapley value gives the cost contribution of BitTorrent traffic – Compare to other traffic on the network – Is BitTorrent’s cost more than its “fair share” by volume?
BitTorrent peaks at 3AM BitTorrent peaks at 9PM
BitTorrent’s contribution to cost
BT BT Other Other
SLIDE 23 Otto, Sánchez, Choffnes, Bustamante & Siganos
23
On Blind Mice and the Elephant
- BitTorrent traffic is generally more
expensive than other traffic
- What traffic characteristics result in
high relative cost?
Additional cost of BitTorrent traffic, percent above relative cost of 1
ISP X ISP A ISP B ISP C ISP G
SLIDE 24 Otto, Sánchez, Choffnes, Bustamante & Siganos
24
- High relative cost of BitTorrent
– Large coefficient of variation (“C.V.”, size of peaks in BitTorrent traffic) – Small cross-correlation offset (“X-corr”, alignment with overall traffic)
On Blind Mice and the Elephant
Out-of-phase peaks Aligned peaks Small peaks Large peaks
SLIDE 25 Otto, Sánchez, Choffnes, Bustamante & Siganos
25
- High relative cost of BitTorrent
– Large coefficient of variation (“C.V.”, size of peaks in BitTorrent traffic) – Small cross-correlation offset (“X-corr”, alignment with overall traffic)
On Blind Mice and the Elephant
Out-of-phase peaks Aligned peaks ISP B X-corr: 3.2 hours C.V.: 188% Relative cost: 50% ISP A X-corr: -7.1 hours C.V.: 130% Relative cost: 13% ISP F X-corr: 7.4 C.V.: 325% Relative cost: 52% ISP E X-corr: 1.6 C.V.: 158% Relative cost: 83% Small peaks Large peaks
SLIDE 26
Otto, Sánchez, Choffnes, Bustamante & Siganos
26
BitTorrent is still alive and costly
– Most traffic stays at the edge of the network – It is moving into prime-time – Logically, it is relatively more expensive
A broad view from the edge of the network is
required to see the system’s full usage spectrum
Approach is general to understanding other
distributed systems
– Video streaming – Peer-to-peer CDNs
On Blind Mice and the Elephant