
SLIDE 1
Andrew Renshaw University of California, Irvine
ANT 2011 Oct 11th 2011
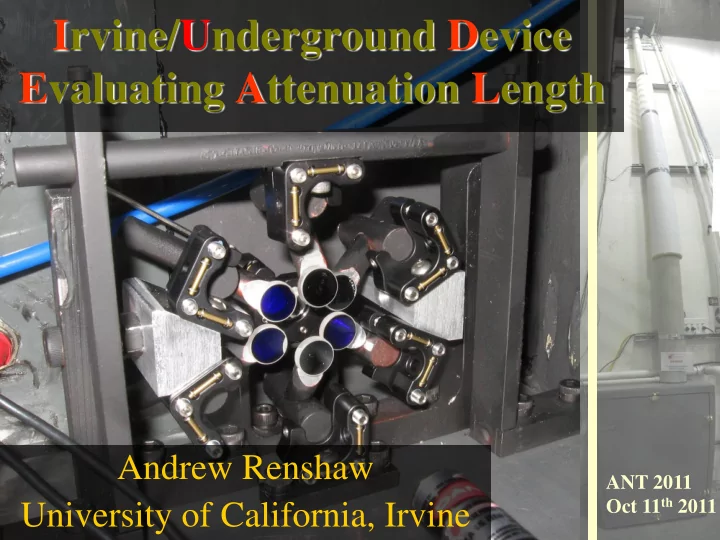
Irvine/Underground Device Evaluating Attenuation Length Andrew - - PowerPoint PPT Presentation
Irvine/Underground Device Evaluating Attenuation Length Andrew Renshaw ANT 2011 Oct 11 th 2011 University of California, Irvine The Labs UCI Laboratory Setup IDEAL band - pass pure water Gd pretreat system system system Gd removal
ANT 2011 Oct 11th 2011
pure water system “band-pass” system Gd removal system soak system IDEAL Gd pretreat system
UDEAL
Band-pass system Resin Removal System 15 m3 Tank 200 ton tank
Light Injector
measurements of Si photodiodes
relevant wavelengths
inject/monitor light at top measure light at bottom
Lasers triggered by standard pulse generator (msec scale pulses at 8-12 Hz) Supply Sources 1) Ultrapure water system 2) “Band-pass” prototype 3) “New” simple soak system 4) 200 ton stainless steel tank 5) 15 m3 polypropylene tank 6) EGADS “band-pass” system
Realtime extinction curve fitting Point by point laser stability monitoring Laser selection and beam steering Parameter selection C++ GUI, developed in Borland Turbo C++
Realtime
Point by point measurement monitoring Oscilloscope connection and trigger options Display settings Acquisition controls
Pulsed laser pointers & professional diodes Integrating sphere & UV enhanced photodiode Adjustable mirrors
Beam splitter & steerer
TRA12PPM actuators; bi-directional repeatability = 3 μm Commands sent via com port to communications controller (NSC200) Multiple actuators, use a switchbox (NSC-CB2) Splitter = Neutral density filter (0.4 OD)
UV transparent acrylic window and removable collecting lens Integrating sphere & UV enhanced photodiode
UV enhanced Si photodiode Large acceptance hole, focusing lens not necessary Photodiodes operated in reverse bias mode with operational amplifier at ±15 V Photodiodes read out with Cleverscope PC
Spheres painted with Lab Sphere Spectraflect paint (> 97% reflectivity for relevant wavelengths)
+0.6%
+0.1%
+5% Laser Pointers
Nitrogen Laser Ratio of measured to monitored integrated intensity, 400 pulses
Although using larger sphere gives less light per cm2, scattering of data is reduced, continued use of larger sphere shows consistent results
229.0 74.9m 23.58 0.58m 73.01 3.24m 142.9 3.5m 121.7 3.7m 108.8 1.4m 22.49 1.12m 73.69 0.55m 337nm 375nm 405nm 445nm 473nm 532nm Pure water measurements done at UCI 10 cm Sphere 30 cm Sphere
board and 16 Channel 12 bit ADC
bypasses, operates the filling and draining valves and pumps and the auto-alignment screen
alignment strip
Reotemp TH Series Accuracy=0.25% of entire span Gave a standard deviation on the height reading of >1 cm Honeywell STJE series Accuracy=0.05% of entire span Gives a standard deviation on the
Webcam used to take picture of the laser beam spots Old CD ROM used to automatically push alignment screen into and out-
Resistive strip tells whether screen is in or out
Auto alignment picture taken by the webcamera, with artificial colors over-laid. The green area is pixels above a brightness threshold which are used to find the center
contours of constant radius from the center of the sphere. They appear as ellipses here because the camera sees the screen at a slight angle and with a slight rotation.
2) Create text file with format below
0 align 337nm, 375nm, 445nm, 473nm, align 532nm, align 595nm, align 405nm 225 405nm, align 445nm, 337nm, align 473nm, align 375nm 450 375nm, 445nm, 405nm 675 405nm, 595nm, 532nm, 473nm, 445nm, 375nm, 337nm
3) Either load or reset the alignment parameters 4) Load the text file with format seen above 1) Set valves to supply water or Gd solution 5) Rainbow will process the entire run
45 50 55 60 65 70 75 80 1/17/2011 2/16/2011 3/18/2011 4/17/2011 5/17/2011 6/16/2011 7/16/2011 Percentage Cherenkov Light @ 20 m Top Center Bottom SK
6.454 0.037m 22.07 0.79m 81.62±0.83m 143.4 3.9m 120.4 2.7m 97.73 1.52m 68.41 2.16m
337nm 375nm 405nm 445nm 473nm 532nm 595nm
66.24 0.91m 40.16 0.26m 78.69 1.15m 6.256 0.015m 21.55 0.49m 68.68±0.34m 6.5 days in band-pass system 6.268 0.016m 22.07 0.79m 68.58±0.58m 79.15 0.52m 69.08 1.13m 42.19 0.36m
3.5 days in band-pass system 337nm 375nm 405nm 445nm 473nm 532nm 595nm Translates to only ~20% loss
light travel distance, compared to SK’s best transparency Not bad for first tuning of the “band-pass”
UCI can make very clean water IDEAL/UDEAL perform almost identically EGADS “band-pass” system effectively cleans pure water EGADS “band-pass” works similarly to UCI “band-pass” with Gd
Large integrating sphere gives high precision measurements Additional components make devices fully automated Precision ultrapure water attenuation length measurements (<2% statistical, sys. under study) Key in certifying UCI pure water and “band-pass” systems First measurement of Gd2(SO4)3, has also measured Gd(NO3)3 and GdCl3, found Gd(NO3)3 to be opaque in UV Same performance as IDEAL Key in certifying EGADS “band- pass” system with pure water Measurement of Gd2(SO4)3 at EGADS comparable to IDEAL at UCI
materials
water in the EGADS tank and water system, as well as Gd2(SO4)3 solution in the “band-pass” system
Visible energy seen from neutron capture
deployed into SK)
*Must maintain highest possible level
2.4L vessel
BGO w/ Am/Be
SK in situ monitoring
Asymmetric and symmetric scattering, and absorption measured Fit to parameters, gives total attenuation
Wavelength (nm) Cherenkov spectrum
0. 05 0. 1 0. 15 0. 2 0. 25 0. 3 300 350 400 450 500 550 600
PMT quantum efficiency has been taken into account
Standard Deviation on the Mean Over 400 Pulses
0.01 0.10 1.00 10.00 300 350 400 450 500 550 600 650 Wavelength (nm) Standard Deviation on the Mean (%) UDEAL IDEAL