irrigation Lessons from environmental flow debate Presented by in - - PowerPoint PPT Presentation

irrigation
SMART_READER_LITE
LIVE PREVIEW

irrigation Lessons from environmental flow debate Presented by in - - PowerPoint PPT Presentation

Downstream impacts of irrigation Lessons from environmental flow debate Presented by in Australia A/Professor Willem Vervoort Centre for Carbon Water and Food, Faculty of Agriculture and Environment The University of Sydney Page 1


slide-1
SLIDE 1

The University of Sydney Page 1

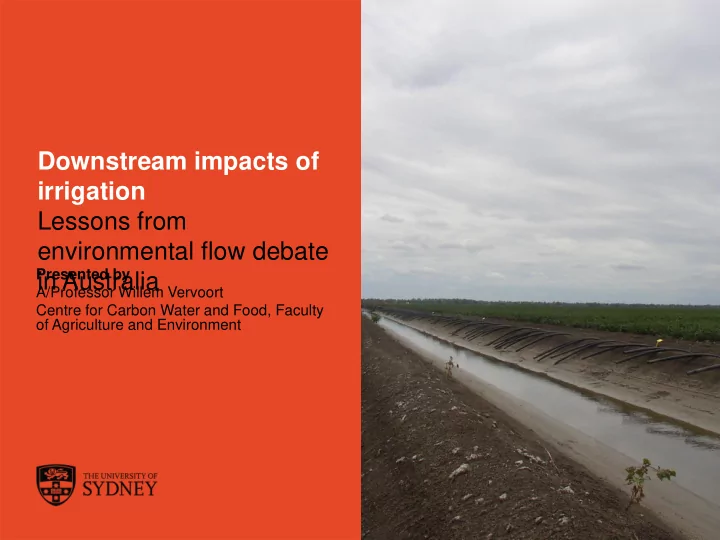
Downstream impacts of irrigation Lessons from environmental flow debate in Australia

Presented by A/Professor Willem Vervoort Centre for Carbon Water and Food, Faculty

  • f Agriculture and Environment
slide-2
SLIDE 2

The University of Sydney Page 2

2000 4000 6000 8000 10000 12000 14000 1920 1970 2020

GL/year Year

NSW VIC SA Qld ACT Total CAP Natural average outflow to the ocean

1993/94

Irrigation diversion in the Murray Darling Basin

  • The Murray Darling Basin is Australia’s

main agricultural production area and largest river basin (1 mln km2)

  • Agriculture (Irrigation) uses 70% of the

water

  • This has severely affected volumes of

flows

  • 1993/94 limit on

licences for extraction: the CAP

  • Since then efforts to

reduce the CAP

  • Water use

efficiency

  • Licence buy back
slide-3
SLIDE 3

The University of Sydney Page 3

CSIRO sustainable yields project and MDB plan 2012

– Additional water needed to sustain environment (wetlands and water dependent ecosystems). – Plan aims at returning 2700 GL/yr, but buyback capped at 1500 GL/yr – Increased role of “water markets”:

– https://www.waterexchange.com.au/cgi- bin/zonetrade/TradingPlatform/Markets

– Agreement between state and commonwealth to “vary” the amount returned to the environment depending on climate

http://www.csiro.au/en/Research/LWF/Area s/Water-resources/Assessing-water- resources/Sustainable- yields/MurrayDarlingBasin

slide-4
SLIDE 4

The University of Sydney Page 4

slide-5
SLIDE 5

The University of Sydney Page 5

How does irrigation extraction and irrigation development affect downstream rivers (locally and globally)

– Reduction in flow.

– Q = Input – ET (long term equilibrium) – Any change in ET will decrease Q: shifting blue water (Q) to green water (ET)

– Flow inversion, timing mismatch between natural high flows and irrigation demands

– Irrigation demand in summer, flows from Dam – Natural high flow in winter, stored in Dam

– Salinity, salt balance

– Salt storage = Salt Input – Salt Output. – To manage salt storage, salt output needs to increase if input increases with irrigation water: Leaching Fraction

– Other water quality issues:

– Blue Green Algae due to low flows – Acid sulphate soil exposure

slide-6
SLIDE 6

The University of Sydney Page 6

Flow impacts of regulation

Impact greater in drought Increase in low flows Decrease in high flows

slide-7
SLIDE 7

The University of Sydney Page 7

What future effects might be a problem

– Currently a major push to protect

– RAMSAR wetland sites – Lower lakes (exit point of system)

– Climate change predictions for Australia:

– Increasing and worsening drought – More intense rainfall

– Storage problem will increase, demand for irrigated agriculture will increase, pressure on ecosystems will increase – How do we deal with data scarcity and data uncertainty?:

– Gauge measurements up to 20% uncertainty – Low density of gauging stations on 1 mln km2 – Semi-arid, anastomising, highly variable rivers – We work at very large scales!

slide-8
SLIDE 8

The University of Sydney Page 8

Australian Hydrology

A typical Australian inland river Daily flows in ML/day

Mean 3681.3 Median 79.0 Stdev 15159.7 CV 4.1

Average 96 days of no flow/year Image from Google Earth

slide-9
SLIDE 9

The University of Sydney Page 9

Current MDB Environmental Water

http://www.mdba.gov.au/what-we-do/environmental-water

– Focuses on improving the resilience of the rivers, wetlands and floodplains and plants and animals related with it. – Driven by “Environmental Watering plan”, which is based

  • n Adaptive management

– Overall environmental objectives (Water Act 2007); – Targets for measuring progress (Part of the Basin Plan), watering of selected wetland sites, based on expert panels; – Monitoring, evaluation and reporting (so progress can be measured and evaluated scientifically); and – Learning by doing.

slide-10
SLIDE 10

The University of Sydney Page 10

What are the great unknowns?

– Thresholds for dependent vegetation:

– How much water can be shared with humans? – What are ecological thresholds across 1 mln km2 – Understanding groundwater and water uptake of groundwater dependent trees (Vervoort & van der Zee, 2012; Holland et al.) – Better understanding of flow variability and drought – Seasonal Forecasting (Montazerolghaem et al. 2015) and climate change (see the excellent BOM website: www.bom.gov.au)

– Connectivity and impact of irrigation

– Managing palaeochannels and deep drainage (e.g. Bennett et al. 2013; Vanags & Vervoort, 2014) – Long term salinity and sodicity (e.g. Shah et al. 2014) – Water use efficiency impacts – Impacts of water trading, especially space-time

slide-11
SLIDE 11

The University of Sydney Page 11

Deep drainage Risk Water uptake by vegetation

Deep drainage risk varies in space Depends on uncertainty in input variables Water uptake from connected groundwater is a function of distance of the stream

slide-12
SLIDE 12

The University of Sydney Page 12

The use of new data

– Satellite data to better understand water balance of a catchment – Soil Moisture and ET data for model calibration to improve water resource planning – Increase model certainty

slide-13
SLIDE 13

The University of Sydney Page 13

Conclusions

– Irrigation and irrigation development will always impact downstream ecosystems and other users – Changes in flow timing, quantity and distribution – Salinity impacts are also unavoidable, simple salt balance

– Exacerbated in a high salt environment

– Large spaces and low data density makes assessment

  • f impacts difficult

– New data and new tools might improve assessing impact – Identification of thresholds is crucial and needs to be more than location or species specific – Impact of climate change?