
SLIDE 1
Iowa's Creative Corridor 2012 Regional Laborshed Analysis Purpose - - PDF document
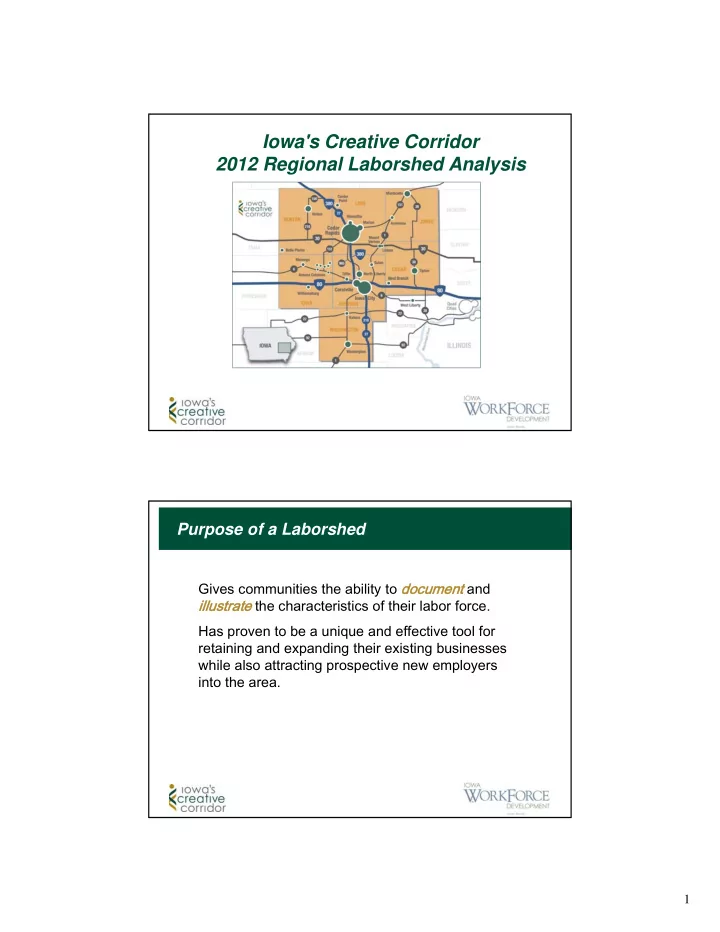
Iowa's Creative Corridor 2012 Regional Laborshed Analysis Purpose of a Laborshed Gives communities the ability to document and illustrate the characteristics of their labor force. Has proven to be a unique and effective tool for retaining and
^ _^ _ ^ _ ^ _ ^ _ ^ _ ^ _ ^ _ ^ _ ^ _ ^ _ ^ _ ^ _
61
151
61
218
380
80
6
163
20
34
80
88
63
330
20
74
5
13
218
30
52 Mount Vernon Tipton Solon Monticello Maquoketa Bernard Manchester Marion Ely Hopkinton Iowa City Anamosa Cascade Coggon Central City Zwingle Earlville Lisbon Wyoming Dubuque Dyersville La Motte Center Point Epworth Lost Nation Springville New Vienna Onslow Oxford Junction Dubuque North Liberty Alburnett Stanwood Cedar Rapids Center Junction Hiawatha Vinton Sumner Tama Muscatine Clinton Marshalltown De Witt Waverly Dysart Marengo Toledo Wilton Oxford Washington Victor Waterloo Chelsea Wellman Williamsburg Clutier Oelwein Parnell Cedar Falls Delhi Winthrop Waterloo Palo Fairbank Ryan Riverside La Porte City Guttenberg Walcott Farley Rowley West Liberty Ainsworth Peosta Amana Clarence West Branch Garwin Strawberry PointEdgewood Ladora Garrison Lowden Atalissa Keystone Hazleton Colesburg North English Mechanicsville Wheatland Baldwin Masonville Van Horne Belle Plaine Dunkerton Norway Calamus Atkins Elberon Swisher Greeley Brandon Dundee Watkins Grand Mound Newhall Blairstown Martelle Tiffin Denver Worthington Janesville Davenport Moscow Bettendorf Monmouth Homestead Mount Auburn Luzerne Stockton Coralville South Amana Davenport Hills Robins Quasqueton Millersburg Grinnell Fairfield Sigourney Brighton Olin Mount Pleasant Brooklyn Palo Malcom Winfield Columbus Junction Clarence Nichols Wayland Lone Tree Fairfax Bennett Eldridge Webster South English Shellsburg Conesville Blue Grass Durant Moline Crawfordsville Le Claire Davenport Moscow Bettendorf New Liberty West Chester Walker Montezuma Deep River Harper Keswick What Cheer Guernsey Traer Jesup Independence ReinbeckHudson Garrison Buckingham Evansdale Ottumwa Oskaloosa Hedrick Wapello Ollie Delta Keota Muscatine Letts Burlington Batavia Kalona Danville Columbus Junction Richland Mediapolis New London Rose Hill Lockridge Fremont Packwood Mount Union Libertyville
^ _
GRANT LAFAYETTE HENRY KNOX MERCER JO DAVIESS ROCK ISLAND WARREN WHITESIDE CARROLL HENDERSON STARK STEPHENSON PEORIA LINN TAMA IOWA JONES BENTON JASPER CEDAR CLINTON KEOKUK SCOTT JACKSON MARION JOHNSON DUBUQUE MAHASKA GRUNDY BUTLER LOUISA HENRY MARSHALL DELAWARE BUCHANAN POWESHIEK MONROE WAPELLO HARDIN BLACK HAWK WASHINGTON CLAYTON MUSCATINE JEFFERSON BREMER FAYETTE LUCAS FRANKLIN DES MOINES DAVIS VAN BUREN APPANOOSE WAYNE
Area Shown Legend
^ _
Iowa's Creative Corridor Node Communities Iowa City Laborshed Area Mississippi River Interstates 4-Lane Highways US Highways State Highways Illinois County Iowa County Wisconsin County
Legend
^ _
Iowa's Creative Corridor Node Communities Iowa City Laborshed Area Mississippi River Interstates 4-Lane Highways US Highways State Highways Illinois County Iowa County Wisconsin County
*Employment status is self‐identified by the survey respondent. The unemployment percentage above does not reflect the unemployment rate published by the U.S. Bureau
77.7% 6.8% 6.4% 9.1% 21.8% 61.0% 39.5% 24.4%
0% 20% 40% 60% 80% 100% Employed Unemployed* Voluntarily Not Employed/Not Retired Retired
Percent Willing to Change/Accept Employment
Occupational Category Percent of Respondents Potential Total in Region Professional, Paraprofessional & Technical 35.3% 176,431 Managerial/Administrative 19.4% 96,962 Production, Construction, Operating, Maintenance & Material Handling 17.5% 87,466 Clerical/Administrative Support 14.3% 71,472 Service 7.1% 35,486 Sales 4.8% 23,991 Agriculture 1.6% 7,997 Total 100% 499,804
*Range to attract 66% to 75% of the most qualified individuals
Industry Non Salary (per hour) Salary (per year) Agriculture $ 15.63 $ 50,000 Construction $ 22.00 $ 40,000 Manufacturing $ 18.35 $ 70,000 Transportation, Communication & Utilities $ 19.23 $ 64,000 Wholesale & Retail Trade $ 11.33 $ 53,500 Finance, Insurance & Real Estate $ 14.25 $ 61,000 Professional Services $ 13.00 $ 64,500 Healthcare & Social Services $ 18.65 $ 59,000 Entertainment, Recreation & Personal Services $ 11.35 $ 42,500 Government & Public Administration $ 20.05 $ 59,000 Education $ 13.75 $ 55,000
* Insufficient survey data/refused
Occupational Category Non Salary (per hour) Salary (per year) Managerial/Administrative $ 17.71 $ 65,000 Professional, Paraprofessional & Technical $ 20.00 $ 58,000 Sales $ 11.08 $ 50,000 Clerical/Administrative Support $ 15.00 $ 44,250 Service $ 11.00 $ 38,000 Agriculture * * Production, Construction, Operating, Maintenance & Material Handling $ 18.00 $ 51,000
0% 10% 20% 30% 40% 50% 60% 70% 80% 90% 100% 0.6% 0.7% 1.5% 1.7% 1.8% 2.2% 5.7% 14.1% 21.6% 21.6% 29.5% 30.9% 34.4% 51.9% 58.5% 68.6% 91.9%
Health/Medical Insurance Pension/Retirement Options Dental Coverage Paid Vacation Life Insurance Vision Coverage Prescription Drug Coverage Tuition Assistance/Reimbursement Flextime Stock Options Paid Holidays Disability Insurance Paid Sick Leave Paid Time Off Incentive Reward Programs Health Club/Fitness Memberships Flex Spending Accounts
75.9% some level beyond high school 16.6% associate degree 27.2% undergraduate degree 10.0% postgraduate/professional degree
49.6% require additional education/training
Job satisfaction – 50.7% Age near retirement – 22.2% Benefits – 16.1% Good relationship with current employer – 15.0% Seniority/length of service – 9.6% Job security – 7.2% Flexibility – 6.6% Family reasons – 4.3%
Live in one community, but work for an employer in another community Community of Residence Out Commute % Estimated # of Out Commuters Top Employment Destinations (Rank Order) Amanas 30.4% 650 Cedar Rapids, Iowa City Anamosa 53.9% 1,502 Cedar Rapids, Coralville, Marion Cedar Rapids (Hiawatha, Marion, Robins) 13.3% 9,432 Iowa City, Amanas Iowa City (Coralville) 14.5% 6,718 Cedar Rapids, Mount Vernon, West Branch Kalona 65.2% 1,459 Iowa City, Coralville North Liberty 81.7% 5,401 Iowa City, Cedar Rapids Solon 82.7% 2,031 Iowa City, Cedar Rapids, Coralville, North Liberty Tiffin 91.0% 925 Iowa City, Cedar Rapids, North Liberty Tipton 50.0% 1,071 Iowa City, Cedar Rapids, Coralville, Muscatine Vinton 53.3% 1,505 Cedar Rapids, Coralville, Waterloo Washington 25.0% 866 Iowa City, Coralville, Hills, Kalona West Branch 76.7% 1,475 Iowa City, Coralville, North Liberty West Liberty 66.1% 1,298 Iowa City, Coralville, Muscatine
Previous median hourly wage: $11.00 per hr Lowest median hourly wage willing to accept: $10.00 per hr
*Range to attract 66% to 75% of the most qualified individuals
Willing to Accept Employment
Willing to Accept Employment
84.5% Internet
48.4% Local & Regional Newspapers
74.8% Internet
56.3% Local & Regional Newspapers
^ _^ _ ^ _ ^ _ ^ _ ^ _ ^ _ ^ _ ^ _ ^ _ ^ _ ^ _ ^ _
61
151
61
218
380
80
6
163
34
80
88
63
20
52
74
13
218
30
52
^ _
Ottumwa Grinnell Vinton Fairfield Tipton Keota Tama Muscatine Solon Waverly Dysart Oskaloosa Wapello Olin Monticello Maquoketa Wilton Oxford Washington Sigourney Walker Marion Waterloo Williamsburg Ely Oelwein Iowa City Marengo Mount Pleasant Bernard Anamosa Burlington Brighton Kalona Cedar Falls Cascade Wellman Independence Delhi Waterloo Coggon Palo Riverside Guttenberg Central City Earlville Walcott Farley Lisbon West Liberty Ainsworth Columbus Junction Amana Wyoming Richland Dubuque Nichols Dyersville Mediapolis Wayland West Branch Lone Tree Center Point Strawberry Point New London Lowden Fairfax Bennett Atalissa Hazleton Mechanicsville Eldridge Springville Atkins Mount Vernon Swisher Shellsburg Cedar Rapids Onslow Newhall Blairstown Tiffin Conesville Davenport Blue Grass Durant Dubuque Dubuque Moline Crawfordsville Davenport North Liberty Davenport Moscow Stanwood Bettendorf New Liberty Homestead Mount Auburn Toddville Coralville Cedar Rapids Waterloo Evansdale Iowa City Davenport Robins GRANT GREEN LAFAYETTE RO KNOX HENRY PEORIA LEE BUREAU MERCER WHITESIDE OGLE WARREN JO DAVIESS CARROLL STARK STEPHENSON ROCK ISLAND HENDERSON MARSHA WOODFO PUTN LINN TAMA IOWA JONES BENTON CLAYTON DAVIS CEDAR FAYETTE CLINTON BUTLER KEOKUK SCOTT JACKSON HENRY DUBUQUE MAHASKA GRUNDY LOUISA ALL DELAWARE BREMER BUCHANAN POWESHIEK MONROE WAPELLO VAN BUREN WASHINGTON PPANOOSE MUSCATINE JEFFERSON DES MOINES JOHNSON BLACK HAWK
Legend
^ _
Iowa's Creative Corridor Node Communities Mississippi River Interstates 4-Lane Highways US Highways State Highways Illinois County Iowa County Wisconsin County
Legend
^ _
Iowa's Creative Corridor Node Communities Mississippi River Interstates 4-Lane Highways US Highways State Highways Illinois County Iowa County Wisconsin County
Respondent Concentration by Place of Residence (per ZIP Code)
Low (1 - 4) Moderate (5 - 13) High (14 - 51)
Respondent Concentration by Place of Residence (per ZIP Code)
Low (1 - 4) Moderate (5 - 13) High (14 - 51)
65.4% education beyond high school
3.0% trade certified
1.4% vocational training
14.2% associate degree
21.4% undergraduate degree
6.1% postgraduate/professional degree
74.6% are/were full-time
29.3% Varied shifts
40.8% Seasonal work
46.1% Temporary work
9.8% hold two or more jobs
Average 44 hrs/week
Area Shown
Concentration of those with transferable experience/skills by place of residence
65.4% Education beyond high school
21.4% Undergraduate degree
6.1% Postgraduate/professional degree
21.8% Employed/willing to change
9.8% hold two or more jobs
Average 44 hours/week
Willing to commute 24 miles one- way
2.9% Underemployed
76.5% Education beyond high school
26.7% Undergraduate degree
14.1% Postgraduate/professional degree
21.8% Willing to Change
12.0% hold two or more jobs
Average 42 hours/week
Willing to commute 15 miles one- way
4.5% Underemployed
Employment Status
Employed Unemployed Voluntarily Not Employed/Not Retired Retired Employment Status 86.9% 5.0% 4.7% 3.4% Change/Accept 23.8% 63.0% 42.1% 28.6% Employed Unemployed Voluntarily Not Employed/Not Retired Retired Employment Status 78.0% 10.2% 5.4% 6.4% Change/Accept 20.5% 59.2% 34.7% 17.5% Employed Unemployed Voluntarily Not Employed/Not Retired Retired Employment Status 77.7% 6.8% 6.4% 9.1% Change/Accept 21.8% 61.0% 39.5% 24.4% 2008 2010 2012
Education Level
0.0% 10.0% 20.0% 30.0% 40.0% 50.0% 60.0% 70.0% 80.0% 2008 2010 2012 0.0% 10.0% 20.0% 30.0% 40.0% 50.0% 60.0% 70.0% 2008 2010 2012
Job Search, Employed Willing to Change
* Presented in rank order
2008 2010 2012 Local Newspapers Internet Internet Internet Local Newspapers Local Newspapers Local IowaWORKS Centers Local IowaWORKS Centers Networking Networking Networking Local IowaWORKS Centers Regional Newspapers Walk‐Ins Regional Newspapers
Employed Unemployed Employed Willing to Change Median Wage Median Salary Cedar Valley Regional Partnership Dec-11 76.9% 7.5% 24.5% 14.50 $ 48,500 $ Creative Corridor Nov-12 77.7% 6.8% 21.8% 16.05 $ 56,000 $ Eastern Iowa Economic Development Alliance Jun-09 79.6% 7.7% 25.8% 14.01 $ 50,000 $ Great River Region May-11 71.8% 11.5% 23.1% 14.35 $ 50,000 $ Greater Council Bluffs Partnership Jul-10 71.7% 15.8% 23.6% 13.70 $ 49,000 $ Greater Des Moines Partnership Jul-12 73.2% 9.1% 24.1% 16.20 $ 60,000 $ Iowa Lake Corridor Development Jul-12 78.0% 6.9% 25.6% 14.23 $ 54,000 $ Mid Iowa Growth Partnership Jan-11 78.8% 7.8% 23.0% 14.00 $ 50,000 $ North Central Iowa Alliance Apr-12 78.3% 7.0% 27.4% 15.00 $ 50,000 $ Northeast Iowa Business Network Jul-11 78.9% 6.9% 26.2% 14.50 $ 50,000 $ Northwest Iowa Development Mar-10 82.1% 8.9% 24.2% 13.00 $ 45,000 $ Opportunity2 Jan-13 74.4% 9.4% 20.2% 15.88 $ 52,000 $ Prosperity Eastern Iowa Oct-12 74.9% 8.5% 25.4% 15.00 $ 55,000 $ South Central Iowa Partnership Nov-11 76.0% 8.4% 25.3% 14.00 $ 47,000 $ Western Iowa Advantage Apr-11 79.9% 7.5% 21.4% 13.50 $ 46,000 $ Why Southwest Iowa Apr-08 79.9% 6.6% 26.2% 12.00 $ 40,000 $ Statewide 2012 Dec-12 75.2% 8.2% 25.1% 15.21 $ 57,000 $
Employed Education Level , Beyond HS Associate Degree Undergraduate Degree Postgraduate/ Professional Degree Cedar Valley Regional Partnership 70.1% 14.9% 21.5% 10.0% Creative Corridor 76.9% 16.2% 26.7% 14.1% Eastern Iowa Economic Development Alliance 66.6% 13.7% 20.8% 10.5% Great River Region 69.8% 13.6% 21.8% 14.4% Greater Council Bluffs Partnership 66.2% 12.5% 20.1% 8.5% Greater Des Moines Partnership 79.5% 12.8% 32.6% 14.3% Iowa Lake Corridor Development 74.6% 15.8% 23.7% 10.1% Mid Iowa Growth Partnership 76.4% 17.0% 23.6% 10.3% North Central Iowa Alliance 72.0% 15.8% 23.6% 7.8% Northeast Iowa Business Network 68.1% 16.5% 21.4% 8.5% Northwest Iowa Development 68.0% 13.6% 21.9% 6.8% Opportunity2 69.2% 14.0% 24.6% 9.6% Prosperity Eastern Iowa 71.5% 14.1% 24.2% 11.8% South Central Iowa Partnership 70.5% 13.2% 22.8% 11.2% Western Iowa Advantage 66.1% 14.8% 21.7% 7.1% Why Southwest Iowa 65.0% 13.7% 18.9% 8.6% Statewide 2012 75.2% 14.7% 26.6% 13.0%
Underemployed Low Hours Underemployed Mismatch Underemployed Income Underemployed Total Cedar Valley Regional Partnership 2.1% 3.3% 1.2% 5.6% Creative Corridor 1.8% 2.5% 1.0% 4.5% Eastern Iowa Economic Development Alliance 1.7% 1.7% 1.5% 4.2% Great River Region 2.4% 2.8% 1.7% 6.0% Greater Council Bluffs Partnership 2.8% 2.6% 2.2% 6.2% Greater Des Moines Partnership 1.9% 2.7% 1.0% 4.4% Iowa Lake Corridor Development 2.1% 3.8% 1.2% 5.6% Mid Iowa Growth Partnership 1.7% 2.9% 1.3% 5.1% North Central Iowa Alliance 2.8% 3.8% 1.3% 6.1% Northeast Iowa Business Network 2.2% 3.4% 1.6% 6.1% Northwest Iowa Development 2.2% 2.8% 1.7% 5.9% Opportunity2 1.7% 2.6% 1.3% 4.6% Prosperity Eastern Iowa 1.9% 2.8% 0.9% 4.7% South Central Iowa Partnership 2.1% 3.6% 1.7% 6.4% Western Iowa Advantage 1.5% 2.8% 1.4% 5.0% Why Southwest Iowa 1.4% 2.3% 1.7% 5.1% Statewide 2012 2.2% 3.1% 1.2% 5.4%